Housing Affordability and Employment – The Property Imperative Weekly 27 Jan 2018

Housing in Australia is severely unaffordable, and despite the growth in jobs, unemployment in some centres is rising. We look at the evidence. Welcome the Property Imperative Weekly to 27th January 2018.

Thanks to checking out this week’s edition of our property and finance digest.   Watch the video or read the transcript.

Today we start with employment data. CommSec looked at employment across regions over the last year. Despite the boom in jobs, the regional variations are quite stark, with some areas showing higher rates of unemployment, and difficult economic conditions. Unemployment has increased in several Queensland regional centres in recent years. Queensland’s coastal regional centres such as Bundaberg, Gympie, Bundaberg and Hervey Bay, known more broadly as Wide Bay (average 9.0 per cent), together with Townsville (albeit lower at 8.5 per cent) have elevated jobless rates. Unemployment also increased along the suburban fringes and city ‘spines’ such as Ipswich (8.1 per cent) in Brisbane and the western suburbs of Melbourne (9.0 per cent). In Western Australia, Mandurah, south of Perth, experienced a significant decline in the jobless rate to an average of 7.0 per cent in December from 11.2 per cent a year ago. Higher income metropolitan areas, especially in Sydney’s coastal suburbs, dominate the regions with the lowest unemployment rates. However, the corridor between Broken Hill and Dubbo has Australia’s lowest regional unemployment rate at 2.9 per cent, benefitting from agricultural, tourism and mining-related jobs growth. You will find there is a strong correlation with mortgage stress, as we will discuss next week.

The Victorian Government has reaffirmed their intent to shortly accept applications for its shared equity scheme known as HomesVic from up to 400 applicants. We do not think such schemes help affordability, they simply lift prices higher, but looks good politically.  This was first announced in March 2017. The $50-million pilot initiative aims to make it easier for first-home buyers to enter the market by reducing the size of their loan, hence reducing the amount they need to save for a deposit. The initiative targets single first-home buyers earning an annual income of less than $75,000 and couples earning less than $95,000. Eligible applicants must buy in so-called “priority areas” which include 85 Melbourne suburbs, seven fringe towns and 130 regional towns and suburbs. In Melbourne, the list includes suburbs around Box Hill, Broadmeadows, Dandenong, Epping, Fishermen’s Bend, Footscray, Fountain Gate, Frankston, LaTrobe, Monash, Pakenham, Parkville, Ringwood, Sunshine and Werribee. Regional centres on the list include Ballarat, Bendigo, Castlemaine, Geelong, La Trobe, Mildura, Seymour, Shepparton, Wangaratta, Warrnambool and Wodonga. The state government said the locations were chosen in growth areas where there was a high demand for housing and access to employment and public transport. Some of these locations are where mortgage stress, on our modelling is highest – we will release the January results next week. The scheme is not available in most of Melbourne’s bayside suburbs, the leafy inner eastern suburbs or some pockets of the inner north.

Overseas, the US Mortgage Rates continue to rise, heading back to the worst levels in more than 9 months.  Rates have risen an eighth of a percentage point since last week, a quarter of a point from 2 weeks ago, and 3/8ths of a point since mid-December.  That makes this the worst run since the abrupt spike following 2016’s presidential election. While this doesn’t necessarily mean that rates will continue a linear trend higher in the coming months, the trajectory is up, reflecting movements in the capital markets, and putting more pressure on funding costs globally.

The Bank for International Settlements (BIS) has published an important reportStructural changes in banking after the crisis“. The report highlights a “new normal” world of lower bank profitability, and warns that banks may be tempted to take more risks, and leverage harder in an attempt to bolster profitability. This however, should be resisted. They also underscore the issues of banking concentration and the asset growth, two issues which are highly relevant to Australia. The report says that in some countries the 2007 banking crisis brought about the end of a period of fast and excessive growth in domestic banking sectors.  Worth noting the substantial growth in Australia, relative to some other markets and of particular note has been the dramatic expansion of the Chinese banking system, which grew from about 230% to 310% of GDP over 2010–16 to become the largest in the world, accounting for 27% of aggregate bank assets.

Back home, an ASIC review of financial advice provided by the five biggest vertically integrated financial institutions (the big four banks and AMP) has identified areas where improvements are needed to the management of conflicts of interest. 68% of clients’ funds were invested in in-house products. ASIC also examined a sample of files to test whether advice to switch to in-house products satisfied the ‘best interests’ requirements. ASIC found that in 75% of the advice files reviewed the advisers did not demonstrate compliance with the duty to act in the best interests of their clients. Further, 10% of the advice reviewed was likely to leave the customer in a significantly worse financial position. This highlights the problems in vertically integrated firms, something which the Productivity Commission is also looking at. The real problem is commission related remuneration, and cultural norms which put interest of customers well down the list of priorities.

The Financial Services Royal Commission has called for submissions, demonstrating poor behaviour and misconduct. It will hold an initial public hearing in Melbourne on Monday 12 February 2018. The not-for-profit consumer organisation, the Consumer Action Law Centre (CALC) said the number of Aussie households facing mortgage stress has “soared” nearly 20 per cent in the last six months, and argued that lenders are to blame. Referencing Digital Finance Analytics’ prediction that homes facing mortgage stress will top 1 million by 2019, CALC said older Australians are at particular risk. The organisation explained: “Irresponsible mortgage lending can have severe consequences, including the loss of the security of a home. “Consumer Action’s experience is that older people are at significant risk, particularly where they agree to mortgage or refinance their home for the benefit of third parties. This can be family members or someone who holds their trust.” Continuing, CALC said a “common situation” features adult children persuading an older relative to enter into a loan contract as the borrower, assuring them that they will execute all the repayments. “[However] the lack of appropriate inquiries into the suitability of a loan only comes to light when the adult child defaults on loan repayments and the bank commences proceedings for possession of the loan in order to discharge the debt,” CALC said. We think poor lending practice should be on the Commissions Agenda, and we will be making our own submission shortly.

The latest 14th edition of the Annual Demographia International Housing Affordability Survey: 2018, continues to demonstrate the fact that we have major issues here in Australia. There are no affordable or moderately affordable markets in Australia. NONE! Sydney is second worst globally in terms of affordability after Hong Kong, with Melbourne, Sunshine Coast, Gold Coast, Geelong, Adelaide, Brisbane, Hobart, Perth, Cains and Canberra all near the top of the list. You can watch our separate video where we discuss the findings and listen to our discussion with Ben Fordham on 2GB.  When this report comes out each year, we get the normal responses from industry, such as Australia is different or the calculations are flawed. I would simply say, the trends over time show the relative collapse in affordability, and actually the metrics are well researched.

Fitch Ratings published its Global Home Prices report. They say price growth is expected to slow in most markets and risks are growing as the prospect of gradually rising mortgage rates comes into view this year. Their data on Australia makes interesting reading. Fitch expects Sydney and Melbourne HPI to stabilise in 2018, due to low interest rates, falling rental yields, increasing supply, limited investment alternatives and growing dwelling completions, partially offset by high population growth. Fitch expects the increase in FTB to be temporary; low income growth, tighter underwriting and rising living costs will maintain pressure on affordability for FTB. As mortgage rates are currently low, any material rate rise will weigh further on mortgage affordability and serviceability. The rising cost of living and sluggish wage growth are likely to increase pressure on recent borrowers who have little disposable income. Fitch expects mortgage lending growth to slow to around 4% in 2018, based on continued record low interest rates and stable unemployment. This will once again be offset by continued underemployment, reduced investor demand and tougher lending practices.

Finally, the latest weekly data from CoreLogic underscores the weakness in the property market. First prices are drifting lower, with Sydney down 0.4% in the past week and Melbourne down 0.1%.  The indicator of mortgage activity is also down, suggesting demand is easing as lending rules tighten. But then we always have a decline over the summer break. The question is, are we seeing a temporary blip, over the holiday season, or something more structural? We think the latter is more likely, but time will tell.

So that’s the Property Imperative Weekly to 27th January 2018. If you found this useful, do like the post, add a comment and subscribe to receive future editions. Many thanks for taking the time to watch.


The Housing Affordability Crisis In Australia

Our latest Video Blog discusses the Demographia Housing Affordability Report with specific reference to Australia.

The latest 14th edition of the Annual Demographia International Housing Affordability Survey: 2018, using 3Q 2017 data continues to demonstrate the fact that we have major issues here. There are no affordable or moderately affordable markets in Australia. NONE!

Global House Prices Will Rise, but Ideal Conditions to End – Fitch

Globally, national house prices are forecast to rise this year in 19 of 22 markets highlighted by Fitch Ratings in a new report, but growth is expected to slow in most markets and risks are growing as the prospect of gradually rising mortgage rates comes into view this year. Their data on Australia makes interesting reading.

Home Prices: Growth Decelerates

Combined capital city home prices showed yoy growth of 6.6% in the year to November 2017, down from 10.9% over the year to December 2016. The increase was driven by Hobart (+12.7%), Melbourne (+11.0%) and Sydney (+7.7%). Melbourne and Sydney experienced slower growth while Hobart experienced faster growth than a year earlier. Continued record low interest rates have supported price growth while gross rental yields slipped to a record low of 3.6% as of October 2017. Tighter lending standards and foreign ownership restrictions have dampened price growth however.

Fitch expects Sydney and Melbourne HPI to stabilise in 2018, due to low interest rates, falling rental yields, increasing supply, limited investment alternatives and growing dwelling completions, partially offset by high population growth.

Affordability: First-Home Buyers Back in the Market FTBs increased to 17.4% of owner-occupied lending in September 2017 from 13.1% in September 2016, after FTB grants were introduced in New South Wales and Victoria in July 2017. The state governments of Australia’s two most populous states have introduced new FTB support, such as abolished stamp duty for properties up to AUD650,000, reduced stamp duty for properties up to AUD800,000, and grants of up to AUD20,000 for the building of new homes.

Although FTB activity has increased since the announcement of the FTB changes, affordability is still a key issue for FTB. This is particularly true in major cities, as wage growth falls behind HPI.

Fitch expects the increase in FTB to be temporary; low income growth, tighter underwriting and rising living costs will maintain pressure on affordability for FTB. As mortgage rates are currently low, any material rate rise will weigh further on mortgage affordability and serviceability.

Mortgage Performance: Low Arrears to Continue

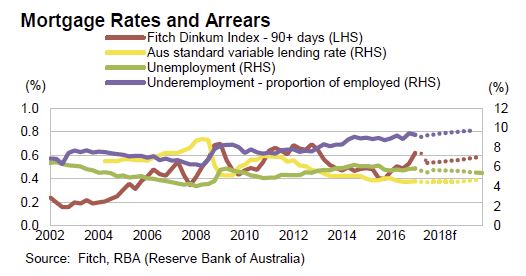
Mortgage arrears remained broadly stable in 1H17. This is despite lenders increasing mortgage rates, particularly for investment and interest-only loans, while the RBA has made no change to the cash rate. As at 3Q17, 30+ days arrears for prime RMBS were 1.02% according to our Dinkum RMBS index, compared with 1.09% at end-2016. The level of under-employment in Australia stabilised at 9.1% of employed persons in 3Q17 (9.2% in 3Q16), and this may be affecting the disposable income and servicing capacity for some borrowers.

Fitch expects mortgage performance to remain stable in 2018, as interest rates stay low. Fitch believes the adoption of APRA-prescribed serviceability practices by lenders in 2016 has improved borrower ability to service mortgage loans originated since then. However, the rising cost of living and sluggish wage growth are likely to increase pressure on recent borrowers who have little disposable income.

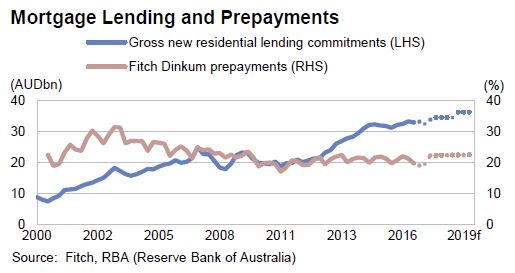
Mortgage Lending: Slower Growth. New mortgage lending growth has slowed in 2017 compared to end-2016, against a background of modest economic growth and reduced investment lending. Home sale transactions decreased in the year to October 2017 by 4.7% nationally (as per CoreLogic); combined capital city sales were 6.0% lower and combined regional market sales were down 2.2%. Lower investor demand, increasing transaction costs, higher capital requirements for banks, further prudential measures restricting lending to investors and stricter serviceability parameters, have restricted access to mortgages for some borrowers.

Fitch expects mortgage lending growth to slow to around 4% in 2018, based on continued record low interest rates and stable unemployment. This will once again be offset by continued underemployment, reduced investor demand and tougher lending practices.

Regulatory Environment: New Measures Introduced

In March 2017, the Australian Prudential Regulation Authority (APRA) announced additional supervisory measures to moderate investment lending in Australia. The APRA expects authorised deposit-taking institutions (ADI) to limit new interest-only lending to 30% of originations; limit growth in investment lending to 10% per year; ensure that serviceability metrics are set at “appropriate levels for current conditions”; and to continue to restrain lending growth in high-risk segments such as high loan-to-income loans, high LVR loans, and long tenure loans. The recently introduced measures relating to interest only lending have already been adopted by lenders and, along with the other restrictions brought in over the past two years, are reflected in the increased pricing of interest only and investment loans.

In July 2017, ownership restrictions were applied in New South Wales and Victoria; a 50% cap on foreign, non-resident ownership in new developments; a levy on foreign, non-resident investors whose properties are vacant for at least six months in a calendar year; increasing the capital gains tax (CGT) withholding rate to 12.5% from 10.0% and increasing the threshold for CGT to AUD2 million from AUD750,000. On 17 July 2017, the Treasury released draft legislation proposing that APRA extend its remit to regulate lending activities of non-ADIs.

Fitch expects the additional regulatory supervision measures to reduce the supply of lending to investors and moderate the house price growth in Sydney and Melbourne in 2018.


They say tighter mortgage regulation, record low rental yields, and increasing supply will slow Australian price growth. FTBs in Sydney and Melbourne received government support in 2017, but the impact is expected to be temporary, considering affordability pressure. Australia and New Zealand will post small rises in arrears as home prices in big cities stabilise.

Australia and the US have had nominal home price growth rates since 2010 of 41% and 32%, respectively, that have been substantially higher than rental growth rates. This has occurred despite a high rental growth of 19% in both countries over this period. Australia’s rental growth rate has flattened since 2016, while the rental growth for the US has been accelerating since then.

Australian housing completions have again been the highest of the countries covered. This has put downward pressure on prices in several cities and regions outside of Sydney and Melbourne, although immigration has kept the ratio per 1000 citizens more stable. In Sydney and Melbourne, much of the excess supply had been taken by non-residents, which will be dampened by limitations put in place in 2017.

Australia’s household debt as a proportion of GDP is now the highest across all tracked countries. It overtook the Danish household debt ratio, which has been deleveraging gradually since the peak of the housing market in 2009, helped last year by stable debt and an increase in GDP. Fitch’s mortgage market and macro outlooks are stable for Australia in 2018, but the high ratio increases reliance on a strong economy.

Here is their global summary.

“Arrears are at very low levels in most markets. They will only move in one direction as mortgage rates rise slowly due to higher policy rates and more expensive bank funding from the gradual unwinding of quantitative easing. Floating-rate loans and borrowers refinancing to new rates will be first affected,” said Suzanne Albers, Senior Director, Structured Finance, Fitch Ratings.

Long-term fixed-rate loans are less exposed to increasing rates, but fewer re-financings mean lower lending volumes, so lenders may face pressure to relax their origination standards, subject to regulatory limits.

Norway, Greece and the UK are the only countries not expected to see price rises this year, but Fitch notes that national trends can mask large performance variations within countries with some regions continuing to see unsustainable price rises while others stagnate or even fall.

“We expect home prices to stabilise in Sydney and Melbourne and show modest declines in Oslo, Toronto and London. However, if corrections are only limited after several years of very high growth, the risk of large price declines in future downturns remains,” added Ms. Albers.

Despite these challenges, six of the 22 housing markets covered by the report have seen upward revisions to their outlooks over the past 12 months compared with three being revised down, leaving just three, the UK, Canada and Norway, in Stable/Negative territory.

Fitch has a positive or stable/positive market outlook for seven of the nine eurozone countries in this report due to expectations for strong economic growth and continued quantitative easing (QE) in 2018. As the unwinding of QE and normalisation of interest rates is only expected in the medium-term, so the highlighted challenges are likely to materialise later than in other regions.

Fitch believes that in 2018 a combination of factors will be needed to constrain house price rises that have gone beyond market fundamentals and are primarily due to buyers’ expectations for further growth. Overheated markets slowed in 2017 when a combination of factors pressured prices, including lending limitations along with more local factors such as heightened supply and falling immigration in Oslo, multi-layered regulatory controls on home purchases and mortgage lending in China and for London, Brexit uncertainty plus the impact of buy-to-let (BTL) changes including lower tax deductibility of rental income.

Non-bank lenders (NBL) in the US, which tend to have more flexible credit standards, are six of the top 10 lenders by volume. In the UK, NBL have focussed on BTL lending where they have not yet been bound by stricter Prudential Regulation Authority guidelines that apply to deposit-taking institutions. NBL (especially government agencies) could also increase competition in Mexico as they move from index-linked lending to peso loans, the traditional market for banks.

Removal of Negative Gearing Would LIFT Home Ownership

More evidence that negative gearing should be revised was contained in a preliminary paper released recently, having been discussed with the RBA in November. Melbourne University researchers Yunho Cho, Shuyun May Li, and Lawrence Uren suggest their modelling shows that the removal of negative gearing would potentially lift homeownership rates by 5.5%, and that “renters and owner-occupiers are winners, but landlords, especially young with high earning landlords, lose”. They stress this is preliminary, but nevertheless it adds to the weight of evidence that negative gearing should be reformed. Their data also again shows how a small number of affluent landlords are benefiting disproportionately at the expense of the tax payer .

The welfare analysis suggests that eliminating negative gearing would lead to an overall welfare gain of 1.5 percent for the Australian economy in which 76 percent of households become better off.

This is significant, given the annual government expenditure
on negative gearing is estimated to be $2 billion, or 5 percent of the budget deficit for the year 2016. Eliminating negative gearing would reduce housing investments and house prices, and increase the average home ownership rate. The supply of rental properties falls, rents increase but only marginally because its demand also falls.

The data in their report also underlines the significant growth in property investors, and the consequential rise in mortgage lending and negative gearing.

The left panel in Figure 1 shows that the proportion of landlords has risen by around 50 percent over the last two decades. The right panel in Figure 1 shows that the real housing loan approvals have also increased dramatically during the same period. In particular, the loan approvals for investment purposes increased more sharply than that for owner-occupied purposes, surpassing it by around $0.5 billion in the early 2010s.

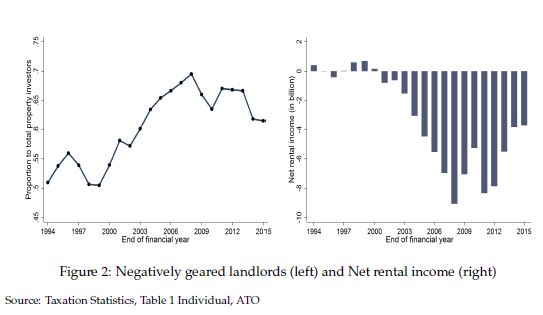
Figure 2 documents the proportion negatively geared landlords and the aggregate net rental income across the period from 1994 to 2015. The left panel in Figure 2 shows that the proportion of negatively geared landlords has increased from 50 percent in 1994 to around 60 percent in 2015. The right panel in Figure 2 shows that the aggregate net rental income became large negative from the early 2000s onwards. Evidence shown in Figures 1 and 2 suggest that Australian households increasingly participate in the residential property investment and take advantage of negative gearing, reducing tax obligations with the flow loss incurred from their housing investment.

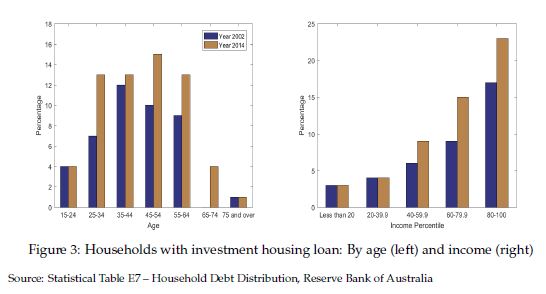
Figure 3 compares the share of households with home loans for investment by age (left panel) and income percentile (right panel) for the years 2002 and 2014. There has been a significant increase in the share, particularly among young to middle-aged households.

The largest increase was occurred in the age group 25 – 35, increased by 85 percent from 7 percent to 13 percent. From the right panel, we find that the share of households with investment housing loans has increased mainly among those in upper income percentiles.

These evidence are in line with the arguments by opponents of negative gearing that the policy essentially benefits the rich households who borrow and speculate in the property market. The fact that the distribution of housing investment loans is different across age and income also motivates our use of a heterogeneous agents incomplete markets model to study the implications of negative gearing.

This is consistent with our own surveys and analysis on negative gearing. Good data and analytics can negate political rhetoric, even it takes time…!

Finally, of course is the important point, should interest rates rise then the value of negative gearing claimed will rise, putting a heavier burden on the Treasury, at a time when the cost of Government borrowing would be also rising. A double whammy – a multiplier effect.

RBA Charts Tell A Tale Of Household Woe

The latest RBA chart pack, a distillation of data to the end of the year, contains a few gems, which underscore some of the tensions in the consumer sector.

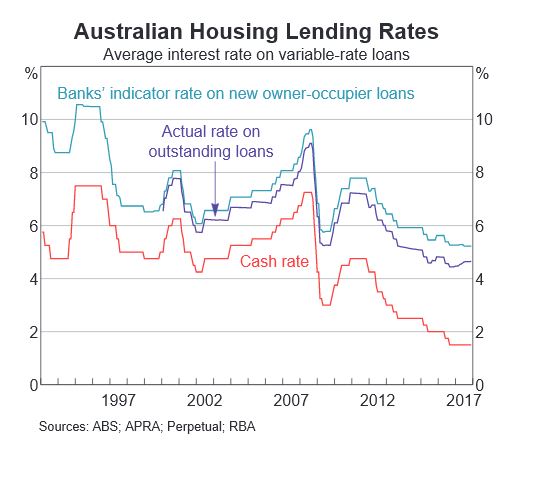
First, relative the the ultra-low cash rate, actual mortgage rates are rising – no surprise given the rise in mortgage stress we are registering.

Next, home loan approvals are on the slide – expect more of this as tighter underwriting standards bite, and many interest only borrowers are forced to switch to higher cost interest and principal loans.

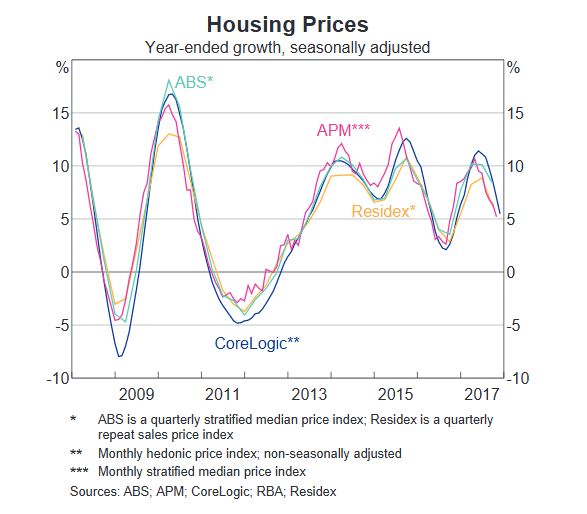
Home price indices are trending lower (but still net positive growth overall at the moment). Expect more falls in the months ahead.

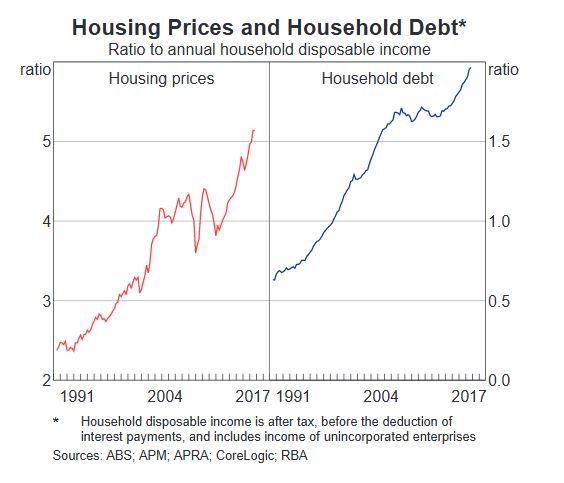
Household debt continues higher. Now double disposable income, and we have some of the most highly in debt households in the world. Lending growth is still three times income, so this is likely to continue higher.

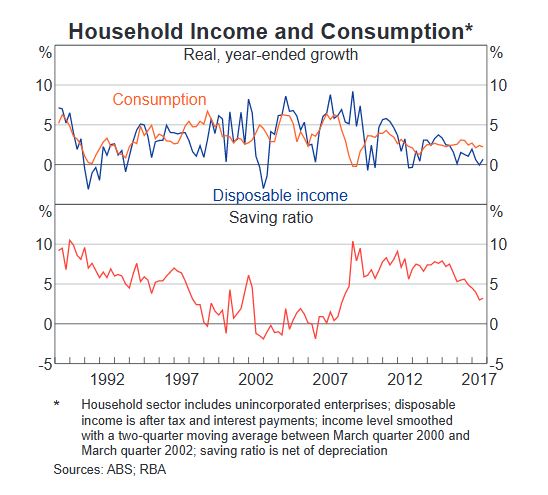
All this is bearing down on household consumption as real income growth stalls. The savings ratio is falling, as households tap these to prop up their finances, OK in the short term, but unsustainable longer term.

The Property Playing Field Is Tilting Away From Investors

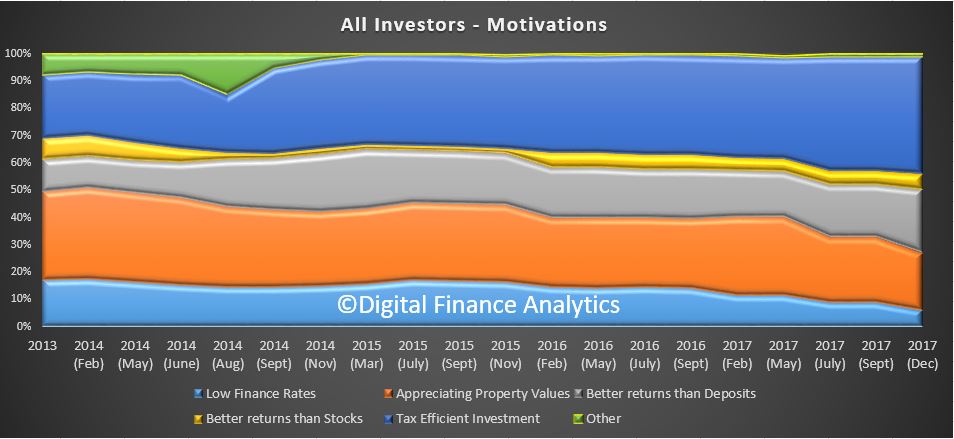
Continuing our series on our latest household survey results, we look more deeply at the attitude of property investors, who over the past few years have been driving the market. We already showed they are now less likely to transact, but now we can look at why this is the case.

Looking at investors (and portfolio investors) as a group, we see the prime attraction is the tax effectiveness of the investment (negative gearing and capital gains tax) at 43% (which has been rising in recent times). But availability of low finance rates and appreciating capital values have both fallen this time around.  They are still driven by better returns than deposits (23%) but returns from stocks currently look better, so only 6% say returns from investment property are better than stocks! Only tax breaks are keeping the sector afloat.

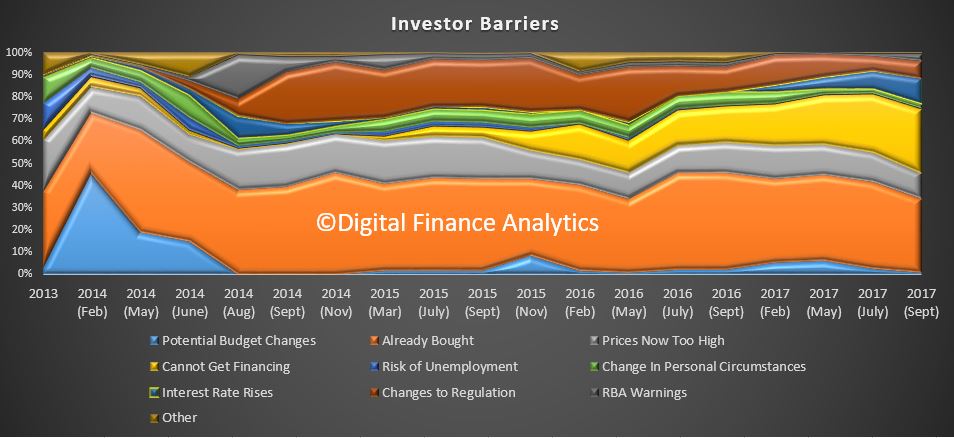
We can also look at the barriers to investing. One third of property investors now report that they are unable to obtain funding for further property transactions, nearly double this time last year.

Then 32% say they have already bought, and are not in the market at the moment. Whilst concerns about more rate rises have dissipated a little, factors such as prices being too high, potential changes to regulation and RBA warnings all registered.

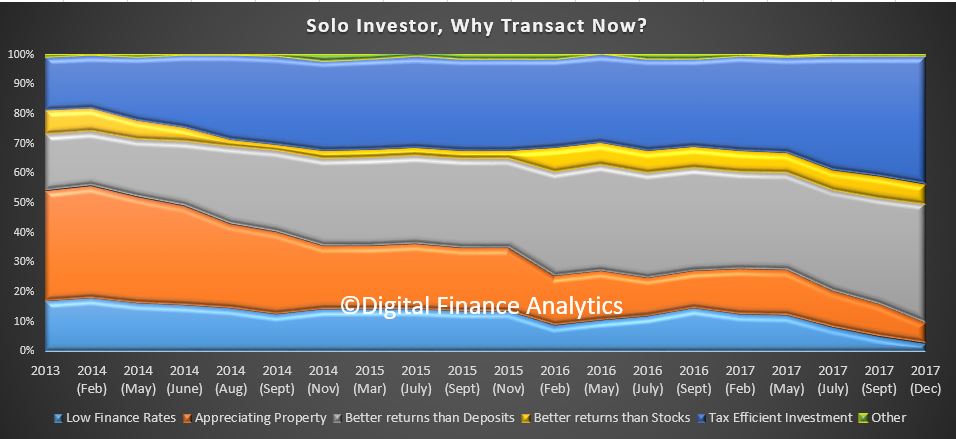
Turning to solo property investors (who own just one or two investment properties), 43% report the prime motivation is tax efficiency, 40% better returns than bank deposits and better returns than stocks (7%). But the accessibility of low finance rates and appreciating property prices have fallen away.

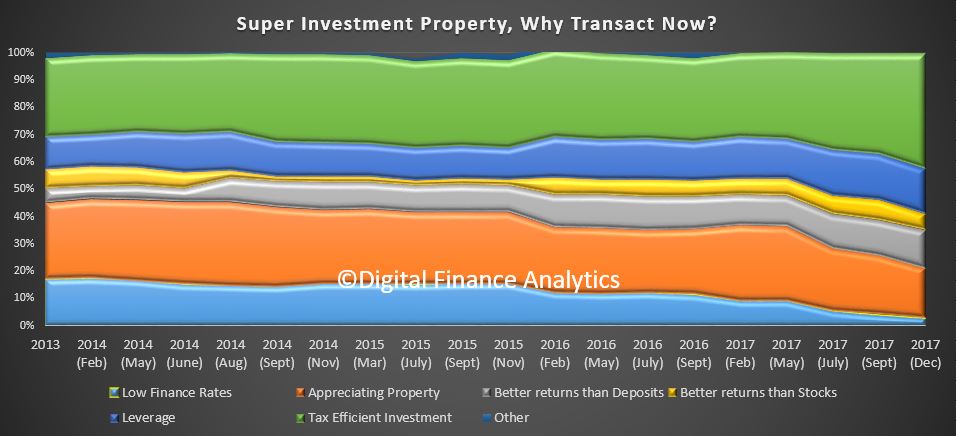
Those investing via SMSF also exhibit similar trends with tax efficiency at 43%, leverage at 16%, and better returns than deposits 14%. Once again, cheap finance and appreciating property values have diminished in significance.

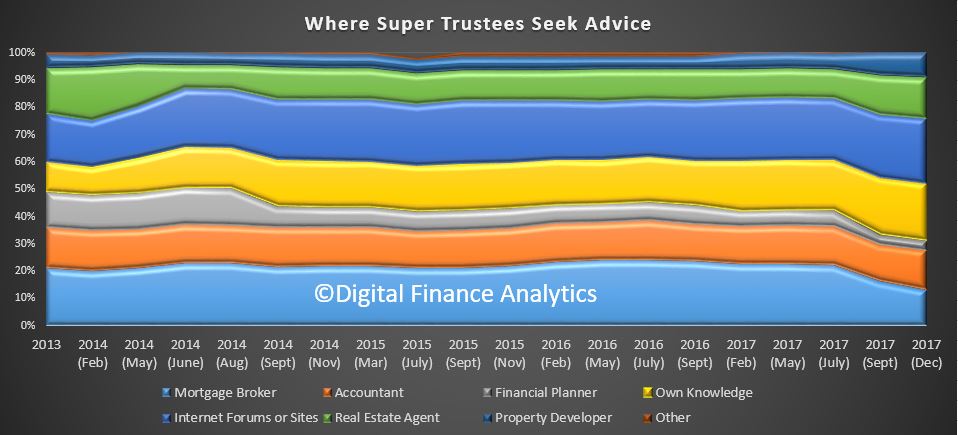
We also see 23% of SMSF trustees get their investment advice from internet or social media sites, 21% use their own knowledge, while 13% look to a mortgage broker, 14% an accountant and 4% a financial planner. 15% will consult with a real estate agent and 9% with a property developer.

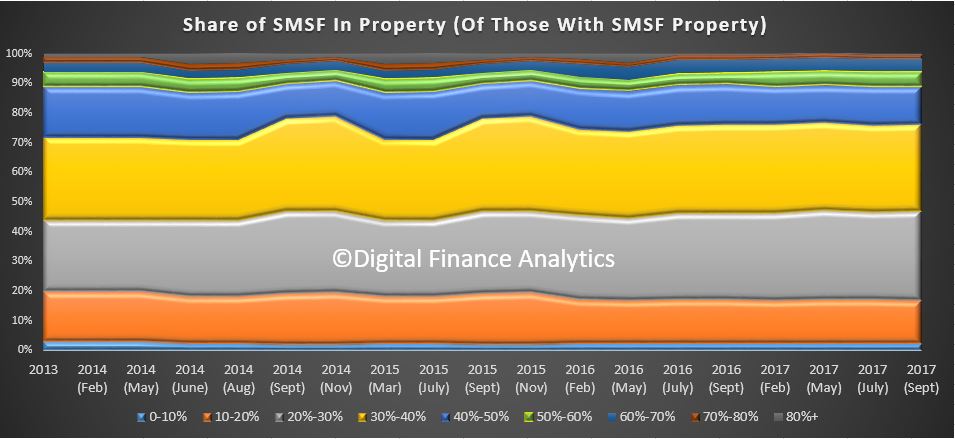
There is a fair spread of portfolio distribution into property. 13% have between 40-50% of SMSF investments in property, 29% 30-40% and 30% 20-30% of their portfolios.

Next time we will look at first time buyers and other owner occupied purchasers. Some are taking up the slack from investors, but is that sufficient to keep the market afloat?

A Year In A Week – The Property Imperative 23 Dec 2017

In This Week’s Edition of the Property Imperative we look back over 2017, the year in which the property market turned, focus on the risks to households increased, and banks came under the spotlight as never before.

Welcome the penultimate edition of our weekly property and finance digest for 2017.

We start with the latest Government budget statement, which came out this week.  There was a modest improvement in the fiscal outlook, largely reflecting a boost in tax collections, including from higher corporate profits in the mining sector. But there was also a consumer shaped hole, driven by low wages, lower consumption and lower levels of consumer confidence. Yet, in the outlook, wages are predicted to rise back to 3%, and this supporting above trend GDP growth. This all seems over optimistic to me.

In any case, according to the IMF, GDP is a poor measure of economic progress, with its origins rooted firmly in production and manufacturing. In fact, GDP misrepresents productivity and they say companies that are making huge profits from mining big data have a responsibility to share their data with governments.

The mortgage industry has seen growth in lending at around 6% though the year, initially led by investors piling into the market, but then following the belated regulatory intervention to slow higher risk interest only lending, momentum has switched to first time buyers, at a time when some foreign buyers are less able to access the market. A third of customers with interest-only mortgages may not properly understand the type of loan they have taken out, which could put many in “substantial” stress when the time comes to pay their debt, UBS analysts have warned. We have also seen a change in mix, as smaller lenders and non-banks (who are not under the same regulatory pressure) have increased their share. AFG’s latest Competition index which came out yesterday, showed that Australia’s major lenders have taken a hit with their market share now down to a post-GFC low of 62.57% of the mortgage market.

Household finances have been under pressure this year, with income growth, one third the rate of mortgage growth, so the various debt ratios are off the dial – as a nation we have more indebted households than almost anywhere else.  This is a long term issue, created by a combination of Government Policy, RBA interest rate settings, the financialisation of property, and the rabid growth of property investors – who hold 35% of mortgages (twice the proportion of the UK). The combination of rising costs of living, and out of cycle rate rises, have put pressure on many households as never before – and we have tracked the rise of mortgage stress through the year to an all-time high.

The latest MLC Wealth Sentiment Survey contained further evidence of the pressure on households and their finances. Being able to save has been a challenge for a number of Australians – almost 1 in 5 of us have been unable to save any of our income in recent years, and for more than 1 in 4 of us only 1-5%. Expectations for future income growth are very conservative – nearly 1 in 3 Australians expect no change in income over the next few years and 15% expect it to fall. Our savings expectations for the future are also very conservative – with more than 1 in 5 Australians believing their savings will fall. The “great Australian dream” of home ownership is still a reality for many, but for some it’s just a dream – fewer than 1 in 10 Australians said they didn’t want to own their own home, but 1 in 4 said home ownership was something they aspired to but did not think it would happen.

Of course the RBA continues on one hand to warm of risks to households, as in the minutes published this week, yet also persists with its line that households can cope, with the massive debt burden, as its skewed towards more wealthy groups. They keep referring to the HILDA survey, which is 3 years old now, as a basis for this assertion. They should take note of a Bank of England Working paper which looked at UK mortgage data in detail, and concluded the surveys tend to understand the true mortgage risks in the market – partly because of the methodology used.  They concluded “These results should make policy makers less sanguine about the developments in the UK mortgage market in recent years, which are traditionally analysed using these surveys”.

The latest report from S&P Global Ratings covering securised mortgage pools in Australia to end Oct 2017, showed 30-day delinquency fell to 1.04% in October from 1.08% in September. They attribute part of the decline to a rise in outstanding loan balances during the month, and many older loans in the portfolios (which may not be representative of all mortgages, thanks to the selection criteria for securitised pools). But 90+ defaults remain elevated – at a time when interest rates are rock bottom.

Banks are under the gun, as Government have turned up the pressure this year. There are a range of inquiries in train, from the wide-ranging Banking Royal Commission (which the Government long resisted, but then capitulated), and a notice requiring banks, insurance companies and superannuation funds to detail all cases of misconduct from 2008 onwards has also been issued. The scope includes mortgage brokers and financial advisers. Also the ACCC is looking at mortgage pricing, The Productivity Commission is looking at vertical integration, and we have the BEAR regime which is looking at Banking Executive Behaviour.  This week we also got sight of the Enhanced Financial Services Product Design Obligations, and of course the major banks copped the bank tax. There are also a number of cases before the Courts. This week, NAB said it had refunded $1.7 million for overcharging interest on home loans and CommInsure paid $300,000 following ASIC concerns over misleading life insurance advertising

This tightening across the board is a reaction to earlier period of market deregulation, privatisation and sector growth. But at its heart, the issue is a cultural one, where banks are primary focussing on shareholder returns (as a company that is their job), but at the expense of their customers.  Even now, the decks are stacked against customers, and the newly revised banking code of conduct won’t do much.  We think the Open Banking Initiative will eventually help to lift competition, and force prices lower. But, after many years of easy money, banks are having to work a lot harder, and with much more lead in the saddle bag. Meantime, it is costing Australia INC. dear.

More significantly, the revised Basel rules, though watered down, still tilts the playing field towards mortgage lending, and makes productive lending to business less attractive.  Also there is more to do on bank stress testing according to the Basel Committee. The regulation framework is in our view faulty.

One question worth considering, as the USA and other Central Banks lift their base cash rates, is whether there is really a “lower neutral rate” now. Some, in a BIS working paper have argued that Central Banker’s monetary policy have driven real interest rates lower, rather than demographics. But another working paper, this time from the Bank of England, comes down on the other side of the argument.  The paper “Demographic trends and the real interest rate” says two-thirds of the fall in rates is attributable to demographic changes (in which case Central Bankers are responding, not leading rates lower). In fact, pressure towards even lower rates will continue to increase. This is a fundamentally important question to answer. We suspect the role of Central Bankers in driving rates is less significant than many suspect, and structural changes are afoot.

Rates in Australia have stayed low this year, at 1.5%, despite the RBA saying this is below the neutral setting, and we expect the bank to move later in 2018, upwards. The rate of rise is now expected to be lower than a year ago, but the international pressure will be up. In addition, the US tax reforms will likely switch more investment to the US, and so banks, who rely on international funding, will likely have to pay more. So we still expect real rates to go higher ahead, creating more pressure on households. Also, of course as rates rise, the costs of Governments running deficits rises, something which will be a drag on the budget later.

Home prices continued to rise through 2017 in the eastern states, while in NT and WA they fell. Recent corrections in Sydney may be an indication of what is ahead in the Melbourne market too. Demand remains strong, but lending standards have been tightened, and investors are getting more concerned about future capital appreciation. This year building approvals were still pretty strong, in line with firm population growth. As an aside, an OECD report this week said that Australian property may well be a target for money laundering, and more needs to be done to address this issue.  Auction volumes continue to slide, and we have seen a significant fall in recent weeks.

So, this year we have seen changes in the financial services landscape, the property market is on the turn, and household’s debt levels are rising, creating financial stress for many. As a result, we expect many to spend less this Christmas.

Next time we will discuss the likely trajectory through 2018, but we wanted to wish all our followers a peaceful and restful holiday season. We have really appreciated all the interest in our work – through the year we have more than doubled our readership, thanks to you.

Many thanks for watching. Check back next week for our views on what 2018 may bring.

Safe as Houses? Not if You Live in Australia

An interesting perspective via a press release from online broker FXB Trading.

Whilst they are pushing their “hedge strategy” for Australian property, drawing parallels with the US crash of 2007; the key points they make are important and largely align with our view of the local property market.  If they are right, recent price falls are just the start!

According to Jonathan Tepper, one of the world’s experts in housing bubbles, Australia is experiencing the biggest property bubble in history. It has lasted 55 years and seen prices increase 6556% since 1961. “It is the only country we know of where middle-class houses are auctioned like paintings,” he observed recently.

When it crashes it’s likely to bring Australia’s economy crashing down with it, as it’s the only sector which has driven GDP growth of late. It’s one of those rare opportunities traders relish because the volatility in the market will be big and significantly increases the chance of being able to make a huge gain from an investment.

You can thank State and Federal governments for this opportunity. They have done everything they can to fuel the housing market in an effort to boost Australia’s economy and offset the decline in the value and volume of its chief exports iron ore and coal. The growth of the economy has provided governments with a source of tax revenue and proof to voters that their policies result in economic success.

The Australian media has also been complicit in the perpetuation of the property bubble. Objective reporting on property has disappeared because the Murdoch and Fairfax duopoly, which controls media output in the country, have been protecting their only major growth profit centres realestate.com.au and Domain the country’s two largest real estate portals.

Headlines celebrating a 26-year-old train driver who services the debt on five million dollars worth of property with his salary and rental income have become commonplace, with hordes of others being similarly celebrated for their achievements.

The formula for success which has enabled individuals on modest incomes to gain ownership of seven figure property portfolios comes through the black magic of cross-collateralised residential mortgages, where Australian banks allow the unrealised capital gain of one property to secure financing to purchase another property.

This unrealised capital gain takes the place of a cash deposit. For instance, if the house bought a year ago for $350,000 is now valued at $450,000 the bank is willing to let the owner use that equity gain to finance the purchase of another property.

LF Economics describe this as a “classic mortgage ponzi finance model”. When the housing market falls, this unrealised capital gain becomes a loss, and the whole portfolio becomes undone. The similarities to underestimation of the probability of default correlation in Collateralised Debt Obligations (CDOs), which led to the Global Financial Crisis (GFC)in 2008, are striking.

However, unlike the US property situation there is no housing shortage in Australia. High housing prices in Australia have not come about because of the natural forces of supply and demand but by the banks’ willingness to lend. Credit from privatised and deregulated financial system has been the leading cause of the property bubble – as it was in the US – which has resulted in loans being granted to a very high percentage of the people who applied for one.

Loose credit was used to speculate on the property market, generating easy profits until the bubble peaked and then collapsed the financial sector in 2008 in the US. Following deregulation of Australia’s financial sector the amount of credit banks extended has increased dramatically. Mortgage debt has more than quadrupled from 19% of GDP in 1990 to 84% in 2012, which is a higher level than that of the US at its peak.

In many other parts of the world the GFC took the wind out of their real estate bubbles. From 2000 to 2008, driven to an extent by the First Home Buyer Grant, Australian house prices had already doubled. Rather than let the market as it was around the rest of the world during the GFC, the Australian Government doubled the bonus. Treasury notes recorded at the time reveal that it was launched to prevent the collapse of the housing market rather than make housing more affordable.

Already at the time of the GFC, Australian households were at 190% debt to net disposable income, 50% more indebted than American households, but the situation really got out of hand.

The government decided to further fuel the fire by “streamlining” the administrative requirements for the Foreign Investment Review Board (FIRB) so that temporary residents could purchase real estate in Australia without having to report or gain approval.

In 2015-16 there were 40,149 residential real estate applications from foreigners valued at over $72 billion in the latest data by FIRB. This is up 320% by value from three years before. Most of these came from Chinese investors.

Many Chinese investors borrowed the money to buy these houses from Australian banks using fake statements of foreign income. According to the Australian Financial Review banks were being tricked with cheap photoshopped bank statements that can be obtained online.

UBS estimates that $500 billion worth of “not completely factually accurate” mortgages now sit on major bank balance sheets.

This injection of foreign investment has made Australian housing completely unaffordable for Australians. Urban planners say that a median house price to household income ratio of 4.1 to 5.0 is “seriously unaffordable” and 5.1 or over “severely unaffordable”.

At the end of July 2017 the median house price in Sydney was $1,178,417 with an average household income of $91,000. This makes the median house price to household income ratio for Sydney 13x, or over 2.6 times the threshold of “severely unaffordable”. Melbourne is 9.6x.

However, the CEOs of the Big Four banks in Australia think that these prices are “justified by the fundamentals”. More likely because the Big Four, who issue over 80% of the country’s residential mortgages, are more exposed as a percentage of loans than any other banks in the world.

How the fundamentals can be justified when the average person in Sydney can’t actually afford to buy the average house in Sydney, no matter how many decades they try to push the loan out is something only an Australian banker can explain.

In October this year Digital Finance Analytics estimated in a report that 910,000 households are now estimated to be in mortgage stress where net income does not cover ongoing costs. This has increased 50% in less than a year and now represents 29.2% of all households in Australia.

Despite record low interest rates, Australians are paying more of their income to pay off interest than they were when they were paying record mortgage rates back in 1989-90, which are over double what they are now.

The long period of prosperity and rising valuations of investments in Australia has led to increasing speculation using borrowed money which neither governments or banks did anything to quell.

The spiralling debt incurred in financing speculative investments has now resulted in cash flow problems for investors. The cash they generate is no longer sufficient to pay off the debt they took on to acquire them. Losses on such speculative assets prompt lenders to call in their loans. This is the point which results in a collapse of asset values.

Over-indebted investors are forced to sell even their less-speculative positions to repay their loans. However, at this point counterparties are hard to find to bid at the high asking prices previously quoted. This starts a major sell-off, leading to a sudden and precipitous collapse in market-clearing asset prices, a sharp drop in market liquidity, and a severe demand for cash.

FXB Trading’s experts have been monitoring Australia’s housing market and its economy for many months and are convinced it has now reached the point of no return and that a crash is imminent.

Its All About Momentum – The Property Imperative Weekly 16 Dec 2017

This week, it’s all about momentum – home prices are sliding, auctions clearance rates are slipping, mortgage standards are tightening and brokers are proposing to lift their business practices – welcome to the Property Imperative Weekly, to 16 December 2017.

Watch the video, or read the transcript. In this week’s edition we start with home prices.

The REIA Real Estate Market Facts report said median house price for Australia’s combined capital cities fell 0.8 per cent during the September quarter. Only Melbourne, Brisbane and Hobart recorded higher property prices and Darwin prices fell the most sharply, dropping 13.8 per cent.

The ABS Residential Property Price Index (RPPI) for Sydney fell 1.4 per cent in the September quarter following positive growth over the last five quarters. Hobart now leads the annual growth rates (13.8%), from a lower base, followed by Melbourne (13.2%) and Sydney (9.4%). Darwin dropped 6.3% and Perth 2.4%. For the weighted average of the eight capital cities, the RPPI fell 0.2 per cent and this was the first fall since the March quarter 2016. The total value of Australia’s 10.0 million residential dwellings increased $14.8 billion to $6.8 trillion. The mean price of dwellings in Australia fell by $1,200 over the quarter to $681,100.

So, further evidence of a fall in home prices in Sydney, as lending restrictions begin to bite, and property investors lose confidence in never-ending growth. So now the question becomes – is this a temporary fall, or does it mark the start of something more sustained? Frankly, I can give you reasons for further falls, but it is hard to argue for improvement anytime soon.  Melbourne momentum is also weakening, but is about 6 months behind Sydney. Yet, so far prices in the eastern states are still up on last year!

CoreLogic said continual softening conditions are evident across the two largest markets of Melbourne and Sydney. This week across the combined capital cities, auction volumes remained high with 3,353 homes taken to auction  and achieving a preliminary clearance rate of 63.1 per cent The final clearance rate last week recorded the lowest not only this year, but the lowest reading since late 2015/ early 2016 (59.5 per cent).

The employment data from the ABS showed a 5.4% result again in November. But there are considerable differences across the states, and age groups. Female part-time work grew, while younger persons continued to struggle to find work. Full-time employment grew by a further 15,000 in November, while part-time employment increased by 7,000, underpinning a total increase in employment of 22,000 persons. Over the past year, trend employment increased by 3.1 per cent, which is above the average year-on-year growth over the past 20 years (1.9 per cent). Trend underemployment rate decreased by 0.2 pts to 8.4% over the quarter and the underutilisation rate decreased by 0.3 pts to 13.8%; both still quite high.

The HIA said there have been a fall in the number of new homes sold in 2017. New home sales were 6 per cent lower in the year to November 2017 than in the same period last year. Building approvals are also down over this time frame by 2.1 per cent for the year. The HIA expects that the market will continue to cool as subdued wage pressures, lower economic growth and constraints on investors result in the new building activity transitioning back to more sustainable levels by the end of 2018.

The HIA also reported that home renovation spending is down, again thanks to low wage growth and fewer home sales by 3.1 per cent. A further decline of a similar magnitude is projected for 2018.

Moody’s gave an interesting summary of the Australian economy. They recognise the problem with household finances, and low income growth. They expect the housing market to ease and mortgage arrears to rise in 2018. They also suggest, mirroring the Reserve Bank NZ, that macroprudential policy might be loosened a little next year.

I have to say, given credit for housing is still running at three times income growth, and at very high debt levels, we are not convinced! I find it weird that there is a fixation among many on home price movements, yet the concentration and level of household debt (and the implications for the economy should rates rise), plays second fiddle. Also, the NZ measures were significantly tighter, and the recent loosening only slight (and in the face of significant political measures introduced to tame the housing market). So we think lending controls should be tighter still in 2018.

The latest ABS lending finance data  for October, showed business investment was still sluggish, with too much lending for property investment, and too much additional debt pressure on households. If we look at the fixed business lending, and split it into lending for property investment and other business lending, the horrible truth is that even with all the investment lending tightening, relatively the proportion for this purpose grew, while fixed business lending as a proportion of all lending fell. I will repeat. Lending growth for housing which is running at three times income and cpi is simply not sustainable. Households will continue to drift deeper into debt, at these ultra-low interest rates. This all makes the RBA’s job of normalising rates even harder.

HSBC, among others, is suggesting a further fall in home price momentum next year, writing that slowdowns in the Sydney and Melbourne housing markets will continue to weigh on national house price growth for the next few quarters. They expect only a slow pace of cash rate tightening and some relaxation of current tight prudential settings as the housing market cools.

Despite this, most analysts appear to believe the next RBA cash rate move will be higher and ANZ pointed out with employment so strong, there is little expectation of rate cuts in response to easing home prices. In addition, the FED’s move to raise the US cash rate this week to a heady 1.5% despite inflation still running below target, will tend to propagate through to other markets later. More rate rises are expected in 2018.  The Bank of England held theirs steady, after last month’s hike.

The UK Property Investment Market could be a leading indicator of what is ahead for our market. But in the UK just 15% of all mortgages are for investment purposes (Buy-to-let), compared with ~35% in Australia.  Yet, in a down turn, the Bank of England says investment property owners are four times more likely to default than owner occupied owners when prices slide and they are more likely to hold interest only loans. Sounds familiar? According to a report in The Economist,  “one in every 30 adults—and one in four MPs—is a landlord; rent from buy-to-let properties is estimated at up to £65bn a year. But yields on rental properties are falling and government policy has made life tougher for landlords. The age of the amateur landlord may be over”.

In company news, Genworth, the Lender Mortgage Insurer announced that it had changed the way it accounts for premium revenue. ASIC had raised concerns about how this maps to the pattern of historical claims. Genworth said that losses from the mining sector where many of the losses occur, do so at a late duration, and improvements in underwriting quality in response to regulatory actions, along with continued lower interest rates, extended the average time to first delinquency. As a result, Net Earned Premium (NEP) is negatively impact by approximately $40 million, and so 2017 NEP is expected to be approximately 17 – 19 per cent lower than 2016, instead of the previous guidance of a 10 to 15 per cent reduction.

CBA was in the news this week, with AUSTRAC alleging further contraventions of Australia’s anti-money laundering and counter-terrorism financing legislation. The new allegations, among other things, increase the total number of alleged contraventions by 100 to approximately 53,800. CBA contests a number of allegations but admit others.  eChoice, in voluntary administration, has been bought by CBA via its subsidiary Finconnect Australia, saying the sale will allow eChoice’s employees, suppliers, brokers, lenders and leadership team to continue to operate and deliver for customers. Finally, CBA announced that, from next year, it will no longer accept accreditations from new mortgage brokers with less than two years of experience or from those that only hold a Cert IV in Finance & Mortgage Broking, in a move intended to “lift standards and ensure the bank is working with high-quality brokers who are meeting customers’ home lending needs.”

The Combined Industry Forum, in response to ASIC’s Review of Mortgage Broker Remuneration has come out with a set of proposals. The CIF defines a good customer outcome as when “the customer has obtained a loan which is appropriate (in terms of size and structure), is affordable, applied for in a compliant manner and meets the customer’s set of objectives at the time of seeking the loan.” Additionally, lenders will report back to aggregators on ‘key risk indicators’ of individual brokers. These include the percentage of the portfolio in interest only, 60+ day arrears, switching in the first 12 months of settlements, an elevated level of customer complaints or poor post-settlement survey results. Now this mirrors the legal requirement not to make “unsuitable” loans, but falls short of consumer advocates, such as CHOICE, who wanted brokers to be legally required to act in the best interests of consumers, in common with financial planners. But both the CBA and CIF moves indicate a need to tighten current mortgage broking practices, as ASIC highlighted, which can only be good for borrowers.  By the end of 2020, brokers will also be given a “unique identifier number”.

ASIC says Westpac will provide 13,000 owner-occupiers who have interest-only home loans with an interest refund, an interest rate discount, or both. The refunds amount to $11 million for 9,400 of those customers. The remediation follows an error in Westpac’s systems which meant that these interest-only home loans were not automatically switched to principal and interest repayments at the end of the contracted interest-only period.

We featured a piece we asked Finder.com.au to write on What To Do When The Interest-only Period On Your Home Loan Ends. There is a sleeping problem in the Australian Mortgage Industry, stemming from households who have interest-only mortgages, who will have a reset coming (typically after a 5-year or 10-year set period). This is important because now the banks have tightened their lending criteria, and some may find they cannot roll the loan on, on the same terms. Interest only loans do not repay capital during their life, so what happens next?

The House of Representatives Standing Committee on Economics released their third report on their Review of the Four Major Banks.  They highlight issues relating to IO Mortgage Pricing, Tap and Go Debt Payments, Comprehensive Credit and AUSTRAC Thresholds. The report recommended that the ACCC, as a part of its inquiry into residential mortgage products, should assess the repricing of interest‐only mortgages that occurred in June 2017, and whether customers had been misled. While the banks’ media releases at the time indicated that the rate increases were primarily, or exclusively, due to APRA’s regulatory requirements, the banks stated under scrutiny that other factors contributed to the decision. In particular, banks acknowledged that the increased interest rates would improve their profitability.

So, in summary plenty of evidence home prices are slipping, and lending standards are under the microscope. We think home prices will slide further, and wages growth will remain sluggish for some time to come, so more pressure on households ahead.  You can hear more about our predictions for 2018 in our upcoming end of year review, to be published soon, following the mid-year Treasury forecast.

Meantime, do check back next week for our latest update, subscribe to receive research alerts, and many thanks for watching.