The Game Is Up – The Property Imperative Weekly 13 Jan 2018

The game is up. Major changes are rippling through the property market, with continued pressure on many households, so we examine the latest data.

Welcome to the Property Imperative weekly to 13 January 2018. Watch the video or read the transcript.

In this week’s review of the latest finance and property news, we start with the AFG Mortgage Index with data to December 2017. While the view is myopic (as its only their data) it is useful and really highlights some of the transitions underway in the industry.  First, there has been an astonishing drop in the number of interest only loans being written, from 60% of volume in 2015, to 20% now – WOW! We also see a small rise in first time buyer volumes, as expected. So the regulatory intervention is having some impact. However, average loans size is rising (and faster than income and inflation), and Victoria stands out as the state to watch with an increase in average loan size over the past 12 months nearly double the size of the increase in New South Wales. So more still needs to be done on the regulatory front. Overall, the national average loan size is up 2.8% over the past 12 months. The average loan size in New South Wales is now $613,084. Queensland has increased by 3.4% to now be sitting at $416,921. South Australia is up 3.4% to $390,706. The Northern Territory is up 22% to $469,502, albeit from a low volume. Reflecting the challenges being encountered by the WA economy, the state’s average loan size is down 1.1% to $439,944. Finally, the share of the major’s banks is falling, as we have seen from other data, as smaller players and non-banks pick up the slack. The majors now have just 64.2% of the market compared to the non-majors sitting at 35.8%.

There is more evidence of poor mortgage lending practice, according to online property lender Tic:Toc Home Loans as reported in The Australian Financial Review. This is another version of the ‘liar loans’ story, and shows that borrowers are more stretched than some lenders suspect. Tic:Toc says, one in five property borrowers are exaggerating their income and nearly half understating their spending, triggering new concerns about underwriting standards and vulnerability to sharp economic corrections. We see similar issues in our own surveys, as households stretch to get the largest mortgage they can, whatever the cost, and whatever the risk.

APRA  released the final version of the revised reporting requirements for residential mortgage lending. It comes into effect from March and lenders will have to report more fully, including data on gross income, (excluding super contributions), new reporting on self-managed superannuation funds (SMSFs) and non-residents, as well as all family trusts holding residential mortgages. Reporting of refinanced loans should include date of refinance (not original funding date) and APRA says the original purpose of the loan is not relevant to reporting when refinanced. Once again we see APRA in catch-up mode trying to get the data to manage the mortgage lending sector more effectively. We think they have been late to the party, and have much to do.

The chairman of the Australian Competition and Consumer Commission has revealed that there will be some “surprises” in the upcoming draft report into how the banks price residential mortgage products. The inquiry into how the major banks price their mortgage is the first undertaking of the ACCC’s new Financial Sector Competition Unit, which is tasked with undertaking regular inquiries into specific competition issues across the financial sector. Starting with the $1.2 million inquiry into residential mortgage product pricing, the ACCC is aiming to understand how the banks affected by the major bank levy explain any changes or proposed changes to fees, charges or interest rates in relation to residential mortgage products. The inquiry relates to prices charged until 30 June 2018. A draft report will be published in February or March. This will be an important piece of work especially, as the corporate watchdog has also previously warned that the big banks could be in breach of the ASIC Act over the reasons given for hiking interest rates.

Turning to broader economic news, The November data from the ABS shows that Australian retail turnover rose 1.2 per cent in November 2017, seasonally adjusted, with Black Friday and iPhone X sales driving the outcome This follows a 0.5 per cent rise in October 2017. Some will spruke this as a positive sign. However, the more reliable trends are less positive, with the estimate for retail turnover up 0.1 per cent in November 2017 the same as October 2017. This is just 1.7 per cent over that past year, so still weak, reflecting stagnant wage growth, rising costs and high levels of debt. The state trend data showed NSW, ACT and QLD had no change, NT fell 0.2% along with WA, while VIC rose 0.3% and SA 0.4%, and TAS rose 0.2%. Online retail turnover was a new record at 5.5 per cent of total retail turnover. But the key takeaway is that households are continuing to keep their wallets firmly in their pockets.

The latest ANZ Job Ads series for December in seasonally adjusted terms, fell 2.3% largely unwinding the increase over the previous two months. On an annual basis job ads are up 11.4%, a slight moderation from 12.0% y/y growth the previous month. The labour market in 2017 was characterised by widespread job growth (particularly in full time jobs), an increase in participation and a fall in the unemployment rate to a four-year low of 5.4%. Growth in ANZ Job Ads provided a leading signal of this strong performance. But of course this has not been converted to rising wages growth so far.

The Building Approvals data from the ABS was much stronger than expected, with the number of dwellings approved up 0.9 per cent in November 2017, in trend terms, and has risen for 10 months. The strong results were driven by renewed strength in approvals for apartments. Approvals for private sector houses fell 0.1 per cent in November. Private sector house approvals fell in Western Australia (3.3 per cent), New South Wales (0.8 per cent) and Queensland (0.4 per cent), but rose in South Australia (1.3 per cent) and Victoria (1.1 per cent).

Consumer Confidence was stronger in the first week of January according to the ANZ/Roy Morgan index, which jumped 4.7% to 122 last week, leaving it at the highest level since late 2013. It often jumps after Christmas, and perhaps the holidays and ashes victory are colouring perspectives. Certainly, it makes an interesting contrast to our own Household Financial Security Index, which we released this week, based on December 2017 survey data. The latest edition of the Digital Finance Analytics Household Financial Security Confidence Index, fell from 96.1 last month to 95.7 this time, and remains below the neutral measure of 100. You can watch our video where we discuss the research.

Analysis of households by their property owning status reveals that property investors are in particular turning sour, as flat net rental incomes, and rising interest rates hit many, at a time when property capital growth is stalling. Owner occupied households are faring a little better, thanks to a range of ultra-cheap mortgage rates on offer at the moment, but they are also concerned about price momentum. Those without property interests remain the least confident, as the costs of renting outstrip income growth, and more are slipping into rental stress.

More questions came out this week, when The ABC is reporting that a Treasury  FOI request has shown that Federal Labor’s negative gearing overhaul would likely have a “small” impact on home values, official documents reveal, contradicting Government claims the policy would “smash” Australia’s housing market. The previously confidential advice to Treasurer Scott Morrison from his own department said the Opposition’s plan might cause “some downward pressure” and could have “a relatively modest downward impact” on prices. This is further evidence that tackling negative gearing should be a strategic priority to help bring our housing market back to reality.

There is also a blind spot at the heart of macroeconomics according to Claudio Borio Head of the BIS Monetary and Economic Department – the BIS is the Central Bankers Banker. He argues that a core assumption implicit in policy setting is that macroeconomics can treat the economy as if it produced a single good through a single firm. The net effect of this assumption is to drag down interest rates and productivity. The truth is much more complex, and within the economy there are “zombie firms” where resources are effectively misallocated, leading to reduced productivity and lower than expected economic outcomes, which will cast a long shadow through the economic cycle. The bottom line is first, credit booms tend to undermine productivity growth as they occur and second, the subsequent impact of the labour reallocations that occur during a financial boom is much larger if a banking crisis follows. This may also help to explain the current gap between employment and wages growth.

Finally, if you want more evidence of the risks in the system look at the RBA chart pack which was released this week. You can watch our video on this, but first, relative to the ultra-low cash rate, actual mortgage rates are rising – no surprise given the rise in mortgage stress we are registering. Next, home loan approvals are on the slide – expect more of this as tighter underwriting standards bite, and many interest only borrowers are forced to switch to higher cost interest and principal loans. Home price indices are trending lower (but still net positive growth overall at the moment). Expect more falls in the months ahead. Household debt continues higher. Now double disposable income, and we have some of the most highly in debt households in the world. Lending growth is still three times income, so this is likely to continue higher. All this is bearing down on household consumption as real income growth stalls. The savings ratio is falling, as households tap these to prop up their finances, OK in the short term, but unsustainable longer term.

In summary, UNSW’s Professor Richard Holden wrote that troubling borrowing and lending markers in the Australian housing market suggest that the lessons from the US mortgage meltdown have not been learned. He rightly draws comparisons with the USA, as we discussed in last week’s Property Imperative, with loose lending standards, a high penetration of interest only loans, many of which will need to be refinanced to higher rate principal and interest loans down the track, and liar loans. Plus, there are questions about where borrowers are getting their deposits from (even drawing from credit cards or borrowing from the Bank of Mum and Dad), and while more loans are originated via brokers, he suggests the banks are myopic to the risks in their portfolio.  He says we are still left with highly indebted households who have nearly $2 of debt for every $1 of GDP, a raft of interest-only loans that will soon involve principal repayments, and stagnant wage growth, and concludes “Having lived in the US during the mortgage meltdown I’m sorry to say that I’ve seen this movie before. The question is: why haven’t our bankers?” I would add, our Regulators should answer the same question. We are on the brink; the game is up!

And that’s the Property Imperative weekly to 13 January 2018. If you found this useful, do like the post, add a comment, or subscribe to receive future updates. In the past week our YouTube Channel followers have grown by a third, so thanks to all those who joined and the comments you left.  We are busy collecting questions for our next Q&A session, so keep a look out for that.

Meantime, we will be back with more insights in the next few days, and many thanks for taking the time to watch.

HashChing and DFA Top Eight Mortgage Predictions for 2018

Online mortgage marketplace HashChing has collaborated with research firm Digital Finance Analytics to produce the top eight mortgage predictions for 2018.

1. Mortgage interest rates are expected to continue rising. The consensus among HashChing brokers is that major banks will continue to nudge interest rates higher. HashChing broker George Kozah said the average home loan standard variable interest rate of 5.08 per cent (according to Finder.com.au) could rise approximately 75 basis points to 5.83 per cent by the end of the year.

2. Fixed rate deals to be a focus for many lenders. In 2018, there will be a greater mix of very low “special” rates to try and attract first time buyers and owner-occupied refinanced business. Many lenders will focus on fixed rate deals, taking account of lower funding rates. This may change later in the year in line with a strong likelihood that the RBA will lift the official cash rate.

3. Mortgage lending standards will continue to be tightened. This includes lower income multiples, less generous analysis of household expenses, and more conservative assessment of allowable incomes. In addition, the loan to value hurdles will be lower for many borrowers. This means that households who want to enter the market will need to be able to present with a larger deposit. “As a result, I expect more first time buyers will get help from the “Bank of Mum and Dad”, which can be worth as much as $88,000,” said Martin North, principal of Digital Finance Analytics.

4. Mortgage stress will affect more households. Last month, Digital Finance Analytics reported that mortgage stress – which is generally when a household spends more than 30 percent of its pre-tax income on home loan repayments – affected more than 921,000 households in Australia. This could climb to more than a million by the end of 2018, and Digital Finance Analytics attributes the problem to a range of issues, including rising living costs, slow wage growth, and larger mortgages (due to rising home prices).

5. More borrowers likely to refinance home loans away from the big four banks. This trend was demonstrated last year using data from HashChing which showed the greatest exodus (37 percent of national borrowers with the big four banks) from Commonwealth Bank. Smaller lenders are offering variable rate home loans as low as 3.56 per cent, and the clear savings compared to the major banks is prompting an increasing number of borrowers to jump ship.

6. Cooling property prices to continue into 2018. Tougher lending restrictions on investors and interest-only loans has increased the housing supply, leading to property prices in major cities such as Sydney and Melbourne to decline last year. The national median house price index fell to 0.3 per cent in December (according to CoreLogic data), and this trend is expected to continue in 2018. Overall, new residential construction will stay strong, as recent building approvals flow through, but there will be a fall in the number of high-rise units release to the market – especially in Melbourne and Brisbane.

7. First home buyers will make up a greater percentage of borrowers. Softening property prices, greater housing supply and government grants/stamp duty concessions (in states such as NSW, Victoria and Queensland) will see more first home buyers enter the market in 2018. In the first week of the year, HashChing has already seen a considerable uptick in web traffic, with a 12% increase in home loan enquiries from first home buyers compared to this time last year.

8. Mortgage brokers will continue to settle most residential mortgages. The latest industry data shows Australian mortgage brokers settled 55.7 percent of all residential mortgages during the September 2017 quarter, which is up from 53.6 percent in the same quarter last year. While the upcoming changes to mortgage broker commission structures (namely, the elimination of volume incentives) will result in lower lending volumes, brokers will still maintain significant share, and their overall footprint will likely continue to increase.

The Fall Out From The Negative Gearing Expose

The FOI release, which the ABC covered yesterday, highlighted “the Coalition’s phoney defence of negative gearing and capital gains tax discounts before the last election”.

A number of economists at the time disputed the claims that winding back those two tax write-offs would “take a sledgehammer” to property prices because “a third of demand” would disappear from the market.

But as the excellent Rob Burgess has highlighted in the New Daily today, there are two consequential questions which need answering:

The two questions that need answering, is why were Mr Turnbull and Mr Morrison making such obviously false claims, and why were those claims not torn apart by the Canberra press gallery?

The answer to the first question is straightforward. They were either responding to an ideological commitment from the right-wing of their own party room that tax is somehow optional for asset-rich Australians, or they were following the advice of party strategists who could not see them re-winning government if wealthier Australians did not hear them loudly condemning Labor’s plans.

Historians will not doubt tell us which of those it was in years to come.

The answer to the second question is more complicated.

Journalists were not brazenly siding with the banks who had profited so much from the negatively-geared property investment mania, and they were not simply playing partisan politics in favour of a Liberal-led government.

Rather, the get-rich-quick culture of the then 16-year-old property boom, and the gradually normalised claim that tax avoidance is somehow a basic human right, has infected Canberra policy makers and fourth-estate critics alike.

That’s why in 2016 it was so refreshing to hear NSW planning minister Rob Stokes lay out the moral case against these tax write-offs.

He said at the time: “We should not be content to live in a society where it’s easy for one person to reduce their taxable contribution to schools, hospitals and other critical government services – through generous federal tax exemptions and the ownership of multiple properties – while a generation of working Australians find it increasingly difficult to buy one property to call home.”

While he told the truth, his federal colleagues were telling lies.

They lied on behalf of the 10 per cent of Australians who profit from the tax write-offs, and against the interests of the other 90 per cent.

Perhaps now that the nation’s best-equipped economic modellers have highlighted the benefits of these reforms – around $6 billion a year returned to the budget bottom line – the news media will finally call these laws out for what they are.

They are grossly unfair. They have helped pump up the Australian housing bubble. And they have redistributed tens of billions of dollars from poorer to wealthier Australians.

As interest rates start to rise around the world, and the interest-payment write-offs of property investors start to bite even harder into the federal budget, these laws need urgent reform.

A news media that vigorously holds the defenders of these laws to account would be a good start.

The Property Market is Repeating US Mortgage Mistakes

In an opinion piece on the UNSW site, Professor Richard Holden writes that troubling borrowing and lending markers in the Australian housing market suggest that the lessons from the US mortgage meltdown have not been learned. We agree!

For all the endless discussion of housing prices in Australia, it is very hard to tell if there is a bubble. Sydney price-to-income ratios are the second highest in the world – above London and New York – but hey, Sydney is a great place to live. Supply is constrained by zoning laws, two national parks, a mountain range and an ocean. Yet demand continues to grow, so prices tend to rise.

I don’t know if there’s a bubble in the Australian housing market, but there are some very troubling markers that suggest imprudent borrowing and lending. Just the sort of things that preceded the US housing implosion nearly a decade ago. And I worry that bankers, borrowers, and regulators seem not to have learned the lessons of that very painful piece of economic history.

First, the markers.

Australia lenders will let you borrow a lot compared to your income. If one adjusts for tax and exchange rates and uses an online mortgage calculator, it is easy to see than a major Australian bank will lend about 25% more for the same income level compared with what a major US bank will now lend.

Not only can one borrow a lot, the structure of the loans is often very risk. A staggering 35.4% of home loans in Australia are interest only, according to recent APRA figures. That has dropped from above 40% thanks to APRA’s recent 30% cap on the amount of new loans that can be interest only.

Don’t forget that a key trigger of the US housing meltdown was when five-year adjustable rate mortgages could not be refinanced, and borrowers faced steep upticks every quarter in their interest rates.

Interest-only loans in Australia typically have a five-year horizon and to date have often been refinanced. If this stops then repayments will soar, adding to mortgage stress, delinquencies, and eventually foreclosures.

So-called “liar loans”, where borrowers provide inaccurate information about their income, assets, or expenses to lenders seem both prevalent and on the rise. A UBS survey in late 2017 found that approximately 30 per cent of home loans, or $500 billion worth could be affected. This is exactly what occurred in the US – as anyone who has read Michael Lewis’s book The Big Short, seen the movie, can tell you.

We can’t even be sure that people have true equity in their new properties. With deposit insurance one can get away with a 5% deposit, although it is typically 20% without. But how careful are banks about where the deposit comes from? There are now troubling suggestions that the leading use of unsecured personal loans is for a mortgage deposit.

All of this is aided and abetted by mortgage brokers – or at least some of them. A remarkable 55% of all new mortgages come through a broker. And those brokers get paid based on how many dollars of home loans they write.

Their incentives are thoroughly misaligned with both borrowers and lenders – just as was the case in the US a decade ago. There are also high-powered incentives for those originating loans with banks, creating more moral hazard.

But perhaps the biggest marker of all is the response from lenders. On liar loans, an ANZ spokesperson said UBS’s survey of 907 people was “extremely limited” compared to the total number of home loans.

Opinion polls the day before an election are also small compared to the number of total voters, but they have been pretty accurate in Australian elections overall. A representative sample of around 1000 respondents tells us a lot.

In October last year Westpac CEO Brian Hartzer told the House of Representatives Standing Committee on Economics: “We don’t lend to people who can’t pay it back. It doesn’t make sense for us to do so.”

ANZ’s Shayne Elliott holds the same view, telling the same committee the same thing: “It’s not in our interest to lend money to people who can’t afford to repay.” And if it was them lending their own money then I might believe it. But people act differently when they are playing with other people’s money. That is the essence of the moral hazard problem.

Mr Elliott, also told ABC’s Four Corners that mortgages are all individual risks, saying: “The reality is that housing loans are pretty good because they’re quite diverse in terms of lots of relatively small loans across ah across the country.” “Ah”, indeed. One of the key lessons from the US experience was how highly correlated the risks on mortgages are. Do Australia’s lenders really not get that?

Bubble or no bubble, we seem to be blithely repeating the US housing-market experience in almost every respect. People borrow too much and banks let them; there is moral hazard and fraud in mortgage issuances; regulators finally do something – very little and very late.

The happy scenario is that macro-prudential regulation is finally biting, and that underwriting standards are starting to improve. Even if that is true, we are still left with highly indebted households who have nearly $2 of debt for every $1 of GDP, a raft of interest-only loans that will soon involve principal repayments, and stagnant wage growth.

Having lived in the US during the mortgage meltdown I’m sorry to say that I’ve seen this movie before. The question is: why haven’t our bankers?

Richard Holden is Professor of Economics at UNSW Business School.

This article was originally published in the Australian Financial Review.

Q&A – The Property Imperative Weekly 06 Jan 2018

In this edition of of our Vlog, we answer some of the most popular questions received via our social media channels.

These include the following:

  • How do we define mortgage stress?
  • Do you see parallels here with the US mortgage market in 2005?
  • Will underwriting standards get tougher still?
  • What is the likely trajectory of interest rates and home prices?

Top 10 Mortgage Stress Countdown At December 2017

Following our monthly mortgage stress post, released yesterday, we have updated our video which counts down the most stressed households across the country.

As normal, there are some changes from last month, as conditions vary across the states. But overall, we see relatively more stress in Victoria and New South Wales.  We will count down to the post code with the highest levels of mortgage stress.

We also discuss the causes of mortgage stress and what households might do to mitigate the issues.


Households Under The Mortgage Stress Gun In December

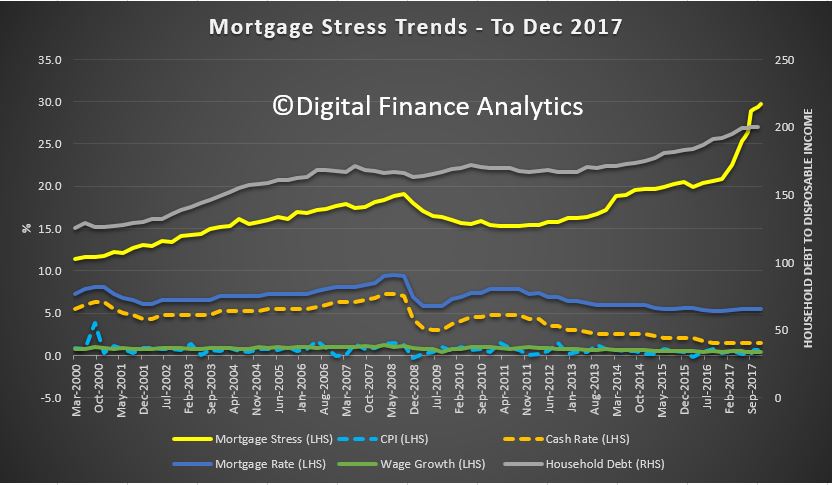
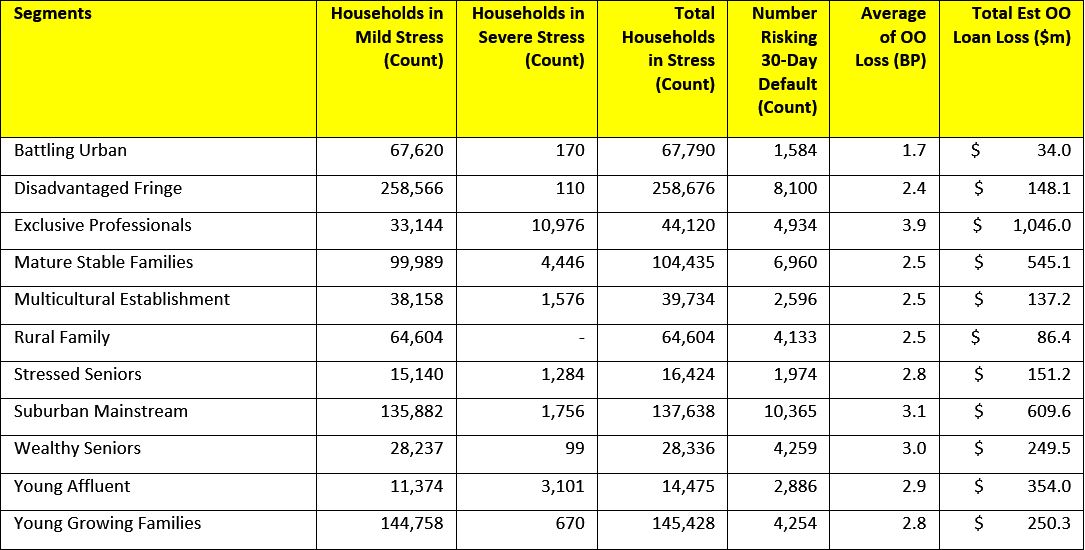
Digital Finance Analytics has released the December mortgage stress and default analysis update. Across Australia, more than 921,000 households are estimated to be now in mortgage stress (last month 913,000). This equates to 29.7% of households. In addition, more than 24,000 of these in severe stress, up 3,000 from last month. We estimate that more than 52,000 households risk 30-day default in the next 12 months, similar to last month. We expect bank portfolio losses to be around 2.8 basis points, though with losses in WA rising to 4.9 basis points. Households in NSW are showing the most significant rise in stress, thanks to larger mortgages relative to income, while income growth is slow.

Martin North, Principal of Digital Finance Analytics said “the number of households impacted are economically significant, especially as household debt continues to climb to new record levels. Mortgage lending is still growing at three times income. This is not sustainable”. The latest household debt to income ratio is now at a record 199.7.[1]

Risks in the system continue to rise, and while recent strengthening of lending standards will help protect new borrowers, there are many households currently holding loans which would not now be approved. This is a significant sleeping problem and the risks in the system are higher than many recognise.

Our analysis uses the DFA core market model which combines information from our 52,000 household surveys, public data from the RBA, ABS and APRA; and private data from lenders and aggregators. The data is current to end December 2017. We analyse household cash flow based on real incomes, outgoings and mortgage repayments, rather than using an arbitrary 30% of income.

Households are defined as “stressed” when net income (or cash flow) does not cover ongoing costs. Households in mild stress have little leeway in their cash flows, whereas those in severe stress are unable to meet repayments from current income. In both cases, households manage this deficit by cutting back on spending, putting more on credit cards and seeking to refinance, restructure or sell their home.  Those in severe stress are more likely to be seeking hardship assistance and are often forced to sell.

The forces which are lifting mortgage stress levels remain largely the same. In cash flow terms, we see households having to cope with rising living costs whilst real incomes continue to fall and underemployment remains high. Households have larger mortgages, thanks to the strong rise in home prices, especially in the main eastern state centres, but now there are signs prices are slipping. While mortgage rates remain quite low for owner occupied borrowers, those with interest only loans or investment loans have seen significant rises.  We expect some upward pressure on real mortgage rates in the next year as international funding pressures mount, a potential for local rate rises and margin pressure on the banks.

Probability of default extends our mortgage stress analysis by overlaying economic indicators such as employment, future wage growth and cpi changes.  Our Core Market Model also examines the potential of portfolio risk of loss in basis point and value terms. Losses are likely to be higher among more affluent households.

Stress by The Numbers.

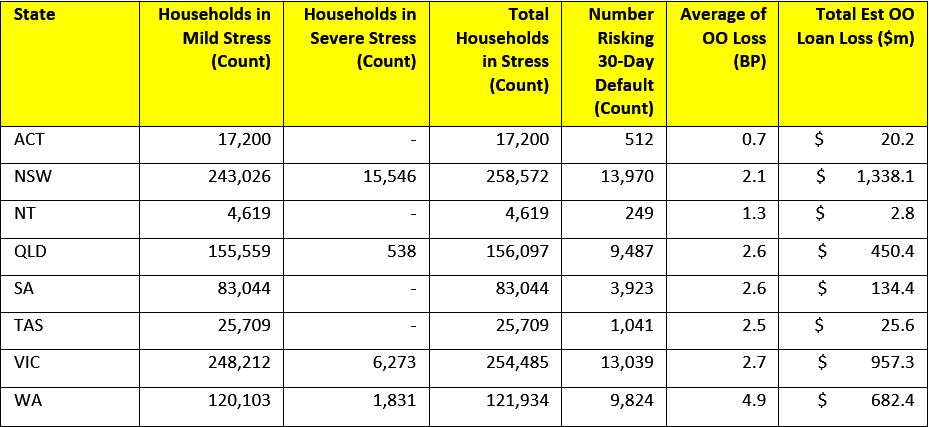
Regional analysis shows that NSW has 258,572 households in stress (251,576 last month), VIC 254,485 (253,248 last month), QLD 156,097 (157,019 last month) and WA 121,934 (123,849 last month). The probability of default rose, with around 9,800 in WA, around 9,500 in QLD, 13,000 in VIC and 14,000 in NSW.

The largest financial losses relating to bank write-offs reside in NSW ($1.3 billion) from Owner Occupied borrowers) and VIC ($957 million) from Owner Occupied Borrowers, which equates to 2.1 and 2.7 basis points respectively. Losses are likely to be highest in WA at 4.9 basis points, which equates to $682 million from Owner Occupied borrowers.

You can request our media release. Note this will NOT automatically send you our research updates, for that register here.

[contact-form to=’mnorth@digitalfinanceanalytics.com’ subject=’Request The December 2017 Stress Release’][contact-field label=’Name’ type=’name’ required=’1’/][contact-field label=’Email’ type=’email’ required=’1’/][contact-field label=’Email Me The December 2017 Media Release’ type=’radio’ required=’1′ options=’Yes Please’/][contact-field label=”Comment If You Like” type=”textarea”/][/contact-form]

Note that the detailed results from our surveys and analysis are made available to our paying clients.

[1] RBA E2 Household Finances – Selected Ratios September 2017

National Dwelling Values Fall 0.3% In December – CoreLogic

Further evidence of cracks showing in the property market in the major centres.

From CoreLogic.

According to the CoreLogic December Hedonic Home Value Index results, national dwelling values slipped lower over the month, led by falls across Sydney, Darwin, Melbourne and Perth . This sets the scene For softer housing conditions In 2018

The transition towards weaker housing market conditions has been clear but gradual and is likely to continue throughout 2018 according to CoreLogic head of research Tim Lawless.

Commenting on the results, Mr Lawless said, “From a macro perspective, late 2016 marked a peak in the pace of capital gains across Australia with national dwelling values rising at the rolling quarterly pace of 3.7% over the three months to November.”

“In 2017 we saw growth rates and transactional activity gradually lose steam, with national month-on-month capital gains slowing to 0% in October and November before turning negative in December.”

According to CoreLogic, the 0.3% fall in December was the catalyst for dragging the quarterly capital gains result into negative territory for the first time since the three months ending April 2016.  Nationally, dwelling values were 4.2% higher over the 2017 calendar year which is a slower pace of growth relative to 2016 when national dwelling values rose 5.8% and in 2015 when values nationally were 9.2% higher.

Index results as at December 31, 2017

2018-01-02--Indices_results

Our Most Popular Posts of 2017

As we tie the ribbons on 2017, here are the top 10 most popular posts from the DFA Blog throughout the past year.

Mortgage stress and the property market were to most visited, but Fintech innovation and household finances also featured.  The ABC Four Corners programme generated the most traffic to our site in a single day. Our earlier research on consumer debt continued to rate very highly.

The Definitive Guide To Our Latest Mortgage Stress Research

October Mortgage Stress Higher Again – See The Top 10 Post Codes

Tic:Toc launches with 22-minute home loan

Mounting concerns over Australian housing bubble

Safe as Houses? Not if You Live in Australia

ABC Four Corners Does Mortgage Stress

6 astonishing features of Australia’s current house price boom

Where Do Consumers Fit in the Fintech Stack?

Digital Finance Analytics – Quenching The Thirst For Accurate Household Mortgage Data

The Stressed Household Finance Report 2015 is Available