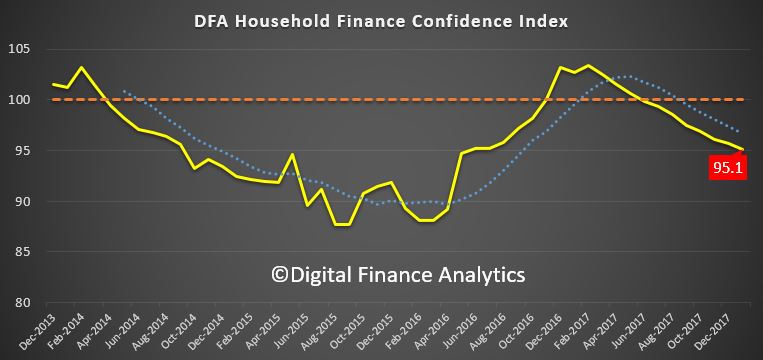
Digital Finance Analytics has released the January 2018 update of our Household Financial Confidence Index, using data from our rolling 52,000 household surveys.
The news is not good, with a further fall in the composite index to 95.1, compared with 95.7 last month. This is below the neutral setting, and is the eighth consecutive monthly fall below 100.
This result highlights the ongoing disconnect between business confidence, and consumers who are still reeling from rising costs of living, flat incomes and high debt.
Across the age bands, there was a small rise in those older than 50 years, but younger households, from 20 -50 all tracked lower.
There was a significant drop in confidence in Victoria, which has now been overtaken again by New South Wales as the most confident state. Confidence fell in South Australia and Queensland, whilst there was little change in Western Australia, which recovered somewhat earlier in the year.
Household’s property footprint impacts confidence levels significantly, with those who are not property active and so living in rented accommodation sitting significantly below those who own property. Owner occupied property holders saw a small uplift this month, reflecting the lower refinancing rates available, and more first time buyers. However, property investors, traditionally the more bullish, continues to languish, dragging the whole index lower.
The segmental scorecard shows that whilst job security rose a little, pressure from large levels of debt rose further, with 44% of households less comfortable than a year ago, and only 3% more comfortable. Pressure on savings continues, with lower returns on deposits, and more dipping into savings to pay the bills. 46% of households were less comfortable with their savings, compared with a year ago, and 4% only were more comfortable.
Costs of living pressures are very real, with 73% of households recording a rise, up 1.5% from last month, and only 3% a fall in their living costs. A litany of costs, from school fees, child care, fuel, electricity and rates all hit home.
On the other hand, only 1% of households records a real rise in incomes compared with a year ago, while 50% said their real incomes had been eroded, and 45% stayed the same. More evidence that incomes are rising more slowly than costs. Those employed in the private sector are particularly hard hit, with many recording no pay rises for the past 2 years.
Finally, household net worth is under pressure for some, as property prices slide, and savings are being eroded (despite high stock market prices). Whilst 58% said wealth had improved, 15% recorded a fall, and 23% said there was no change. A further fall in property prices was the overwhelming concern of those holding real-estate, with more than half now expecting a fall in the months ahead. This expectation is already impacting their spending patterns, and have reduced their prospect of buying more property.
So, overall we see the ongoing slide in household financial confidence, and there is nothing on the horizon which is likely to change momentum. We expect wages growth to remain contained, and home prices to slide, while costs of living pressures continue to grow.
By way of background, these results are derived from our household surveys, averaged across Australia. We have 52,000 households in our sample at any one time. We include detailed questions covering various aspects of a household’s financial footprint. The index measures how households are feeling about their financial health. To calculate the index we ask questions which cover a number of different dimensions. We start by asking households how confident they are feeling about their job security, whether their real income has risen or fallen in the past year, their view on their costs of living over the same period, whether they have increased their loans and other outstanding debts including credit cards and whether they are saving more than last year. Finally we ask about their overall change in net worth over the past 12 months – by net worth we mean net assets less outstanding debts.
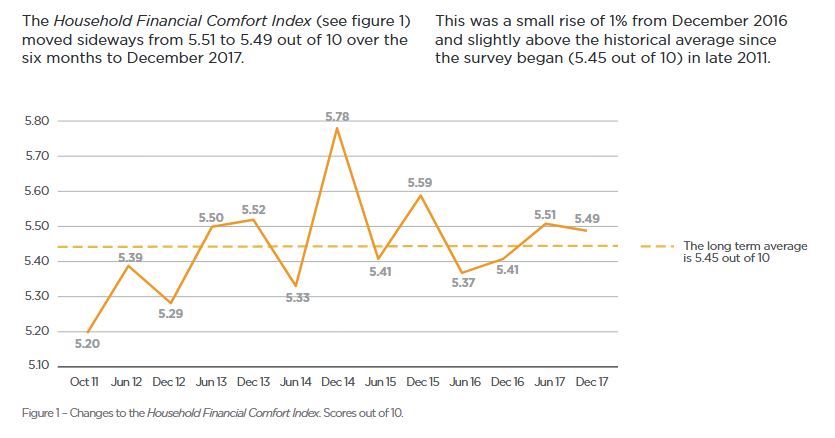
Despite improved job conditions and households reporting healthier financial buffers, the overall financial comfort of Australians is not advancing, according to ME’s latest Household Financial Comfort Report.
In its latest survey, ME’s Household Financial Comfort Index remained stuck at 5.49 out of 10, with improvements in some measures of financial comfort linked to better employment conditions – e.g. a greater ability to maintain a lifestyle if income was lost for three months – offset by a fall in comfort with living expenses.
“Households’ comfort with paying their monthly living expenses fell 3% to 6.40 out of 10 during the six months to December 2017, the lowest it’s been since mid-2014,” said Jeff Oughton, ME consulting economist and co-author of the report.
“In fact, ME’s latest report shows many households’ financial situation is getting worse and again the culprit is living expenses, with 40% reporting this as a key reason their situation is worsening.
“Around 46% of households surveyed also cited the cost of necessities such as fuel, utilities and groceries as one of their biggest worries.
“It’s unsurprising households are still feeling the pinch, given subdued income growth and the rising costs of energy, childcare, education and health.
“If it wasn’t for a decline in comfort with monthly living expenses, the report’s overall Household Financial Comfort Index would’ve likely increased,” said Oughton.
“The rising cost of necessities is currently holding Australians back when it comes to their finances.”
Oughton said that over the past year, 16% of households were not always able to pay their utility bills on time, while 19% sought financial help from family or friends and 13% pawned or sold something to buy necessities – a clear illustration of bill stress, particularly for those on lower incomes.
In other findings from the ABS, childcare costs have doubled in the past six years, while the cost of primary and secondary education has increased by 50%.
But Oughton said one household group of Australians is bucking the trend.
“Households under 35 years old without children – commonly dubbed the ‘avocado generation’ − many of whom have benefited from improved employment conditions without the burden of childcare costs or potentially a mortgage, are not as worried. Their financial comfort rose by 8%, and their comfort with living expenses increased 2% during 2017.”
Oughton said the report’s most encouraging result was households’ improved ability to maintain a lifestyle, if income was lost for three months, which rose 3% to 4.82 out of 10 in the past six months to December 2017 – its highest outcome since 2015. This finding reflects stronger labour market conditions, although mainly among full-time workers.
Victorians’ comfort plummets, while NSW’s rises
Household financial comfort in Victoria dropped significantly below New South Wales’ financial comfort for the first time since the survey began in 2011.
New South Wales improved by 3% in the past six months to 5.83 out of 10 in December 2017, the highest in three years, while Victoria fell 7% to 5.30 out of 10, its lowest level in the past six years.
“New South Wales’ superior financial comfort can be linked to greater confidence in handling a financial emergency (loss of income for three months) – a reflection of healthier employment conditions in the state,” said Oughton.
“Meanwhile, Victoria’s decline can be attributed to falls across most key drivers of financial comfort, including lower confidence in handling a financial emergency (loss of income for three months) and less comfort with investments.
“The discrepancy between the two states is significant given both have traditionally felt similar levels of comfort in the past,” added Oughton.
High levels of mortgage payment stress – set to worsen
More than half of households (56%) renting or paying off a mortgage reported they are contributing over 30% of their disposable household income towards this cost – a common indicator of financial stress – with 72% of renters spending 30% or more of their disposable income on rent and 46% of those paying off a mortgage putting 30% or more of their disposable income towards this.
Furthermore, the proportion of households who ‘worried about their household’s level of debt over the last month’ increased by 1 point to 38%. This proportion increased to 51% among mortgage holders, compared to 27% with no mortgage and 23% who own their own home outright.
“Seven per cent of households reported they could not always pay their mortgage on time during the past year, and 7% could not pay their rent on time.”
“Mortgage defaults may escalate if interest rates increase, particularly among vulnerable low-income households already dealing with the rising cost of necessities,” said Oughton.
The gap between Australia’s rich and poor continues to widen
A disparity in financial comfort between some household groups remain, with 30% of households reporting their financial situation worsened in the past year, while 35% reported it remained the same and 35% reported it improved.
“Around 61% of households with ‘low levels of comfort’ reported a significant worsening in their overall financial situation during 2017, while almost 70% of households on ‘high levels of comfort’ reported that their financial comfort improved during 2017. In other words, the rich are getting richer and the poor are getting poorer,” said Oughton.
Hardest hit were households with incomes below $40,000, 45% of which said their financial situation had worsened, as well as single parents and baby boomers, 36% of which reported their situation had worsened.
For the third consecutive report, disparity was also evident in household income improvements, with more than 50% of those earning over $100,000 reporting income gains while only 29% of those earning between $40,001 and $75,000 reporting income gains.
“Despite continued improvement in the labour market and general economic conditions, the benefits are not trickling down to many households. For these households it will only get worse as the cost of necessities keeps going up,” added Oughton.
Other findings
SA still feeling the pinch: Household financial comfort in South Australia fell by 4% to 5.00 out of 10 during the past six months, to remain the lowest of the mainland states.
WA and QLD continue to trend higher: Comfort in both Western Australia and Queensland remained broadly unchanged at 5.49 and 5.39 out of 10 respectively. Both resource-dominated regions are recovering from the mining downturn to be more in line with the level of household financial comfort reported across Australia as a whole.
The Household Financial Comfort Report is based on a survey of 1,500 Australians conducted by DBM Consultants in December 2017. The Report is produced every six months, with the first survey conducted in October 2011.
The Home Price Crunch is happening now, but how low will prices go and which areas will get hit the worst? Welcome to the Property Imperative Weekly to 3rd February 2018.
Welcome to our digest of the latest finance and property news. Watch the video or read the transcript.
There was lots of new data this week, after the summer break. NAB released their Q4 2017 Property Survey and it showed that property dynamics are shifting. They see property prices easing as foreign buyers lose interest, and a big rotation from the east coast. Tight credit will be a significant constraint. National housing market sentiment as measured by the NAB Residential Property Index, was unchanged in Q4, as big gains in SA and NT and WA (but still negative) offset easing sentiment in the key Eastern states (NSW and VIC). Confidence levels also turned down, led by NSW and VIC, but SA and NT were big improvers. First home buyers (especially those buying for owner occupation) continue raising their profile in new and established housing markets, with their share of demand reaching new survey highs. In contrast, the share of foreign buyers continued to fall in all states, except for new property in QLD and established housing in VIC, with property experts predicting further reductions over the next 12 months. House prices are forecast to rise by just 0.7% (previously 3.4%) and remain subdued in 2019 (0.8%). Apartments will under-perform, reflecting large stock additions and softer outlook for foreign demand.
Both CoreLogic and Domain released updated property price data this week. It is worth comparing the two sets of results as there are some significant variations, and this highlights the fact that these numbers are more rubbery than many would care to admit. Overall, though the trends are pretty clear. Sydney prices are sliding, along with Brisbane, and the rate of slide is increasing though it does vary between houses and apartments, with the latter slipping further. For example, Brisbane unit prices have continued their downward slide, down to $386,000; a fall of 2.2 per cent for the quarter and 4.4 per cent for the year. Here units are actually at a four-year low. Momentum in Melbourne is slowing though the median value was up 3.2 per cent to $904,000 in the December quarter, according to Domain. Perth and Darwin remains in negative territory. Domain said Darwin was the country’s worst performer with a 7.4 per cent drop in its median house price to $566,000 and a 14 per cent plunge in its unit price to $395,000, thanks to a slowing resources sector. It also hit Perth, with a house median fall of 2.5 per cent to $557,000, and its units 1.7 per cent to $369,000. On the other hand, prices in Hobart and Canberra are up over the past year and Hobart is the winner, but is it 17% or 12%, a large variation between the two data providers? And is Canberra 8% or 4%? It depends on which data you look at. Also, these are much smaller markets, so overall prices nationally are on their way down. My take out is that these numbers are dynamic, and should not be taken too seriously, though the trend is probably the best indicator. Perhaps their respective analysts can explain the variations between the two. I for one would love to understand the differences. The ABS will provide another view on price movements, but not for several months.
The latest ABS data on dwellings approvals to December 2017 shows that the number of dwellings approved fell 1.7 per cent in December 2017, in trend terms, and has fallen for three months. Approvals for private sector houses have remained stable, with just under 10,000 houses approved in December 2017, but the fall was in apartments, especially in NSW and QLD. More evidence of the impact of the rise in current supply of apartments, and why high rise apartment values are on the slide. Also, the ABC highlighted the fact that Real estate sales companies are using big commissions to tempt mortgage brokers, financial planners and accountants to sell overpriced properties to unsuspecting clients. This is a way to offload the surplus of high-rise apartments, and looks to be on the rise, another indicator of risks in the property sector.
In other economic news, the ABS released the latest Consumer Price Index (CPI) which rose 0.6 per cent in the December quarter 2017. Annual inflation in most East Coast cities rose above 2.0 per cent, due in part to the strength in prices related to Housing. This follows a rise of 0.6 per cent in the September quarter 2017. However, there were some changes in methodology which may have impacted the results. Softer economic conditions in Darwin and Perth have resulted in annual inflation remaining subdued at 1.0 and 0.8 per cent respectively. Many commentators used this data to push out their forecast of when then RBA may lift the cash rate – but my view is we should watch the international interest rate scene, as this is where the action will be.
Whilst the FED held their target rate this week, there is more evidence of further rate rises ahead. Most analysts suggest 2-3 hikes this year, but the latest employment data may suggest even more. The benchmark T10 bond yield continues to rise and is at its highest since 2014, and now close to that peak then of about 3%. Have no doubt interest rates are on their way up. This will put more pressure on funding costs around the world, and put pressure on mortgage rates here. In fact Alan Greenspan, the former Fed Chair, speaking about the US economy said “there are two bubbles: We have a stock market bubble, and we have a bond market bubble”. “Irrational exuberance” is back! He said we’re working, obviously, toward a major increase in long-term interest rates, and that has a very important impact, on the whole structure of the economy. Greenspan said. As a share of GDP, “debt has been rising very significantly” and “we’re just not paying enough attention to that.” US rate hikes will lift international capital market prices, putting more pressure on local bank margins.
We published our latest mortgage stress research, to January 2018, Across Australia, more than 924,000 households are estimated to be now in mortgage stress compared with 921,000 last month. This equates to 29.8% of borrowing households. In addition, more than 20,000 of these are in severe stress, down 4,000 from last month. We estimate that more than 51,500 households risk 30-day default in the next 12 months, down 500 from last month. We expect bank portfolio losses to be around 2.7 basis points, though with losses in WA are likely to rise to 4.9 basis points. Some households have benefited from refinancing to cheaper owner occupied loans, giving them a little more wriggle room in terms of cash flow. The typical transaction has saved up to 45 basis points or $187 each month on a $500,000 repayment mortgage. You can watch our separate video blog on the results, where we count down the top 10 most stressed postcodes.
But the post code with the highest count of stressed households, once again is NSW post code 2170, the area around Liverpool, Warwick Farm and Chipping Norton, which is around 27 kilometres west of Sydney. There are 7,375 households in mortgage stress here, up by more than 1,000 compared with last month. The average home price is $815,000 compared with $385,000 in 2010. There are around 27,000 families in the area, with an average age of 34. The average income is $5,950. 36% have a mortgage and the average repayment is about $2,000 each month, which is more than 33% of average incomes.
We continue to see mortgage stress still strongly associated with fast growing suburbs, where households have bought property relatively recently, often on the urban fringe. The ranges of incomes and property prices vary, but note that it is not necessarily those on the lowest incomes who are most stretched. Banks have been more willing to lend to these perceived lower risk households but the leverage effect of larger mortgages has a significant impact and the risks are underestimated.
The latest data from The Australian Financial Security Authority, for the December 2017 quarter shows a significant rise in personal insolvency – a bellwether for the financial stress within the Australian community. The total number of personal insolvencies in the December quarter 2017 was 7,578 and increased by 7.4% compared to the December quarter 2016. This year-on-year rise follows a rise of 8.0% in the September quarter 2017.
This is in stark contrast to the latest business conditions survey from NAB. They say that the business confidence index bounced 4pts to +11 index points, the highest level since July 2017, perhaps driven by a stronger global economic backdrop and closes the gap between confidence and business conditions. Business confidence is strongest in trend terms in Queensland and SA and to a lesser extent NSW. Confidence is also reasonable in WA, and is in line with business conditions in the state. Victoria and Tasmania meanwhile are reporting levels of confidence which are lower than their reported level business conditions. But the employment index suggests employment growth may ease back from current extraordinary heights.
The RBA credit aggregates data reported that lending for housing grew 6.3% for the 12 months to December 2017, the same as the previous year, and the monthly growth was 0.4%. Business lending was just 0.2% in December and 3.2% for the year, down on the 5.6% the previous year. Personal credit was flat in December, but down 1.1% over the past year, compared with a fall of 0.9% last year. This is in stark contrast to the Pay Day Loan sector, which is growing fast – at more than 10%, as we discussed on our Blog recently (and not included in the RBA data). Investor loans still make up around 36% of all loans, and a further $1.1 billion of loans were reclassified in the month between investment and owner occupied loans, and in total more than 10% of the investor mortgage book has been reclassified since 2015.
The latest data from APRA, the monthly banking stats for ADI’s shows a growth in total home loan balances to $1.6 trillion, up 0.5%. Within that, lending for owner occupation rose 0.59% from last month to $1.047 trillion while investment loans rose 0.32% to $553 billion. 34.56% of the portfolio are for investment purposes. The portfolio movements within institutions show that Westpac is taking the lion’s share of investment loans (we suggest this involves significant refinancing of existing loans), CBA investment balances fell, while most other players were chasing owner occupied loans. Note the AMP Bank, which looks like a reclassification exercise, and which will distort the numbers – $1.1 billion were reclassified, as we discussed a few moments ago.
Standing back, the momentum in lending is surprisingly strong, and reinforces the need to continue to tighten lending standards. This does not gel with recent home price falls, so something is going to give. Either we will see home prices start to lift, or mortgage momentum will sag. Either way, we are clearly in uncertain territory. Given the CoreLogic mortgage leading indicator stats were down, we suspect lending momentum will slide, following lower home prices. We will publish our Household Finance Confidence Index this coming week where we get an updated read on household intentions. But in the major eastern states at least, don’t bank on future home price growth.
If you found this useful, do like the post, leave a comment or subscribe for future updates. By the way, our special post on Bitcoin will be out in the next few days, we have had to update it based on recent market gyrations.
Almost a third (31%) of South Korea’s workers have invested in bitcoin and other cryptocurrencies.
According to a recent survey by South Korean job portal Saramin, respondents had invested an average of 5.66 million won (~S$7,000) in virtual currencies.
The survey – which involved almost 1,000 South Korean workers, most of whom were in their 20s to30s – also found that more than eight of out 10 of these investors had made money off of trading bitcoin.
More than half of respondents (54%) felt that cryptocurrency trading was “the fastest way to earn high profits”.
The country is now one of the hottest markets for cryptocurrencies, ranking third behind the US and Japan. It is also home to Bithumb, one of the world’s largest cryptocurrency trading exchange.
Bitcoin trading has become so ubiquitous in South Korea that the phrase “bitcoin zombie” is now commonly used to refer to people who constantly check the token’s price through day and night, whether at work or at play.
The cryptocurrency investment frenzy has become chaotic enough for even the country’s prime minister, Lee Nak-yeon, to weigh in. Last year, he warned that it could “lead to serious distortion or social pathological phenomena, if left unaddressed”.
The South Korean government recently implemented restrictions and measures to curb the intensity of speculative investments into bitcoin and other cryptocurrencies — leading more than 200,000 people signed a petition protesting these measures.
An unprecedented ageing process is unfolding in industrialised economies. The share of the population over 65 has gone from 8% in 1950 to almost 20% in 2015, and is projected to keep rising. What are the macroeconomic implications of this change? What should we expect in the coming years? In a recent staff working paper, we link population ageing to several key economic trends over the last half century: the decline in real interest rates, the rise in house prices and household debt, and the pattern of foreign asset holdings among advanced economies. The effects of demographic change are not expected to reverse so long as longevity, and in particular the average time spent in retirement, remains high.
An unprecedented demographic change…
Population ageing is typically summarised by the old age dependency ratio, the ratio of the population over 65 relative to the working population. In industrialised countries, this ratio has risen from under 15% in 1950 to over 30% in 2015, and is forecast to rise to 50% in the next 20 years (dark blue line in Chart 1). Looking at a few countries where population data is available from the 19th century, shown in the dashed lines in Chart 1, this trend is unprecedented. While falling birth rates do play a part, the trend is driven predominantly by increasing longevity. The same ageing process is also happening, albeit more slowly, in middle and low income countries.
Chart 1: Old Age Dependency Ratio across industrialised countries (%)
Note: The ratio is defined as population over 65 divided by population aged 20-64. The thick navy line shows aggregate data from the UN Population Statistics for 17 industrialised countries (Australia, Austria, Belgium, Canada, Denmark, France, Germany, Ireland, Italy, Japan, Netherlands, New Zealand, Portugal, Spain, Switzerland, UK and USA), and dashed navy lines show the high- and low-fertility scenarios in their projections. Thin dashed lines show the historical data for Belgium, Denmark, France, Netherlands, Switzerland and UK from The Human Mortality Database.
From an individual perspective, this trend reflects an increasing fraction of life spent in old age. People that reach retirement age can now look forward to living a further 20 years, on average. Assuming no change in the retirement age, this number is projected to rise to almost 30 years for generations born 20 to 30 years from now. Consider that when Bismarck, Lloyd George and others pioneered state pensions over a century ago, workers were lucky merely to reach retirement age. While raising the retirement age can work to stabilise the time spent in retirement relative to time spent working, the increases proposed in most advanced economies are not yet enough to offset this rise in life expectancy.
… with a profound effect on desired wealth accumulation…
One of the primary ways that population ageing affects the economy is through savings and wealth accumulation. While many developed countries have some form of implicit transfers from workers to retirees through state pensions, private saving remains an important component of retirement income. This is evident in the life-cycle pattern of wealth holdings: in the United States, where the most data is available, wealth peaks close to retirement age and then falls gradually (Chart 2).
Chart 2: Net worth over the life-cycle, with and without housing (thousand US Dollars)
Note: The data is taken from Survey of Consumer Finances, averaged over 1989-2013. The dark solid line shows total net worth, and the light dashed line shows net worth excluding housing wealth.
The rise in life expectancy raises the economy’s desired level of wealth for two reasons. Firstly, people need to accumulate more wealth during their working life to fund their consumption over a longer expected retirement. In terms of the life-cycle profile of wealth, all else equal, this would mean that wealth rises more steeply and reaches a higher peak. Secondly, even without any change in behaviour over the life-cycle, the changing population age structure would imply rising aggregate wealth. Specifically, Chart 2 shows us that households accumulate much of their wealth by around age 50, and hold on to that wealth throughout retirement. Therefore, when adding up individuals’ wealth, the increasing share of people in these high-wealth stages of life will imply a higher aggregate level of wealth.
… With far-reaching macroeconomic implications…
What are the macroeconomic effects of this rise in wealth? In terms of a simple concrete example, household savings find their way to firms, who invest them in machines, structures and intangibles such as branding and research. To the extent that it is harder for firms to employ extra machines as profitably as existing ones, i.e. that the returns to these investments are diminishing at the margin, households get lower returns as their savings increase. In other words market interest rates are lower.
The effects of ageing do not stop there. As desired wealth rises, the demand for other assets, including for example housing, also rises, pushing up on prices. Borrowing also rises, in response to both the fall in the interest rate, which makes borrowing cheaper, and the rise in house prices, as younger and less wealthy households borrow to buy housing. Within open economies, countries that are ageing relatively faster will accumulate assets in countries that are ageing relatively more slowly. This would explain why rapidly ageing countries, like Japan or Germany, are lending money to relatively younger countries, such as Australia.
While the mechanism described above is, of course, simplified, there is evidence that the ratio of capital-to-GDP is indeed much higher now than in the past (Chart 3). This provides additional evidence in favour of our underlying mechanism.
Chart 3: Measures of Capital-to-GDP in industrialised countries (Index)
Note: The blue line shows an index of the ratio of the capital stock to value added in the US business sector from Fernald (2014), equal to 1 in 1947. The red line shows an index of the ratio of capital services to GDP for 19 OECD countries, which, for comparison, we normalise to equal the Fernald measure in 1985 when the series begins.
… which are quantitatively significant
In a recent staff working paper, we have embedded the mechanisms described above in a life-cycle model, in order to quantify these effects for industrialised countries. Households in our model follow the life-cycle patterns of work, home ownership and wealth that we see in the data. This means we take as given that retirees keep their high level of wealth, and assume that future retirees will do the same. We assume that households know their life expectancies accurately, take account of current and expected house prices and interest rates, and hence plan ahead for their future consumption. This implies that households are able to save more in anticipation of their longer retirements, rather than having to work longer or give up their consumption in old age.
In equilibrium, the real interest rate adjusts to balance the supply of capital from the household with the demand from firms. This sets to one side the fact that, in practice, there is a large spread between the risk-free interest rate in financial markets and the interest that firms earn on new investments. This spread is comprised, among other things, of various premia for liquidity and risk, and profits that firms earn in excess of their costs, which we abstract from. House prices also adjust to balance demand for housing with a supply that we assume is fixed per head.
We allow birth and death rates to fall in line with UN data and projections for industrialised countries, as defined in Chart 1. This will be the only external driver of the dynamics in our model. We set the model to match the level of interest rates, and some other aggregate variables in the 1970s, and then measure how the demographic trends have affected the economy since then.
We find that demographic change alone can explain 160bps of the 210bps decline in interest rates since the early 1980s measured by Holston et al. (2017). The model predicts an increase in house prices of over 45% since 1970, corresponding to around 75% of the change observed in the data (Chart 4a). It also explains the doubling of the private debt-to-GDP ratio between 1970 and the start of financial crisis, an increase of around 45pp (Chart 4b). These results confirm that ageing does have a sizeable economic impact. Implications for cross-country imbalances are also important: the pattern of foreign asset accumulation (net borrowing and lending) across industrialised economies predicted by the model explains almost 30% of the variation observed in 2010.
Chart 4: House prices and gross private debt-to-GDP in the model and in the data
Note: House prices are shown in percentage deviation from the 1970 value, and private debt-to-GDP is shown as a percentage. In both cases, the blue solid lines show the results of our model simulations and red dashed lines show the equivalent series in the data.
Finally, the model allows us to gauge the effects of demographics going forward, based on the projections in the UN data. Importantly, these effects are set to increase over the future. The retirement of baby boomers is sometimes cited as potentially driving a decrease in aggregate savings. This does not happen in our quantitative model, both because new generations are expecting to live ever longer into retirement, and are therefore saving more, and because we can expect that baby boomers will retain their high wealth levels throughout retirement. This means that population ageing will continue to keep long run interest rates lower than they would otherwise be, as long as life expectancy, in particular the expected duration of retirement, remains high.
Bank Underground is a blog for Bank of England staff to share views that challenge – or support – prevailing policy orthodoxies. The views expressed here are those of the authors, and are not necessarily those of the Bank of England, or its policy committees.
We monitor Pay Day lending – or Small Amount Credit Contracts (SACC) – as they should be called, via our surveys. We have just run our 2017 updates, and we find that SACC lending is still growing, and well above inflation and wage growth. A symptom of financial stress in the community .
Watch the video, or read the post.
But SACC lenders are targeting different borrowers now, and mainly via online channels.
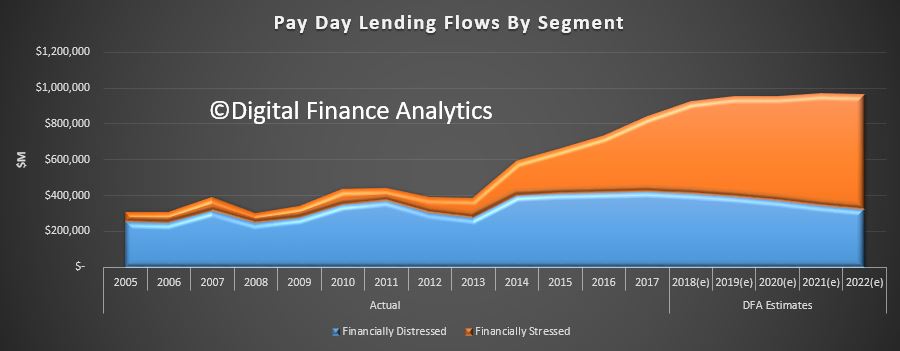
This first chart shows the relative lending flows split by distressed households and stressed households. Stressed households, we define as those with cash flow problems (often thanks to poor budgeting or over commitment) but many will have other financial assets, and even may own property. Most will be in employment. Lenders are targeting this group (especially using TV, radio and online channels) and there has been substantial growth.
Distressed households are those under financial pressure, often with limited employment, and are very likely to be on Government assistance. Recent tightening of the lending rules has reduced the share of lending to these distressed groups – which is a good thing.
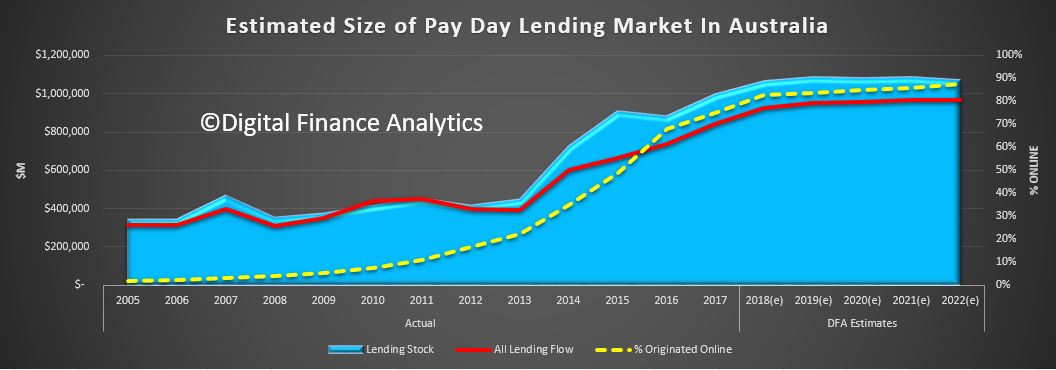
The overall net effect is the total lending from Pay Day providers, including the many online players – has risen to around $842m flow and $994m stock. Growth in 2015 -2016 was 10.7% and 2016-17 was 14.5%. We expect growth at least 10% in 2018, perhaps higher.
The share of loans originated online continues to rise, from 48% in 2015, to more than 75% now, and it will continue to rise further. These online services are easy to access, and borrowers, once they sign up can get “special” deals.
The online environment is of course hard to police, but the interest rates offered by many players are right at the top end of the allowable range.
The latest changes to the SACC legislation are still in the works. But we think there should be a further review looking at the online lending environment. This is clearly where the action (and risks) are. By plugging the lending to our most vulnerable households, the industry has regrouped around more affluent but needy connected households. There are more to target, and the prospect of substantial growth.
For an outline and critique of the proposed payday lending* reforms, see the following articles by Gill North (Professor of Law at Deakin University and Joint Principal of Digital Finance Analytics)
‘Small Amount Credit Contract Reforms in Australia: Household Survey Evidence & Analysis’ (2016) 27 Journal of Banking and Finance Law and Practice 203
‘Small Amount Credit Contract Reforms: Will the Affordability Cap Achieve Its Intended Objectives Without Unintended Adverse Consequences?’ (2017) 32 Australian Journal of Corporate Law 1
‘Small Amount Credit Contract Reforms: Have Transparency and Competition Concerns Been Forgotten?’ (2017) 25 Competition & Consumer Law Journal 101
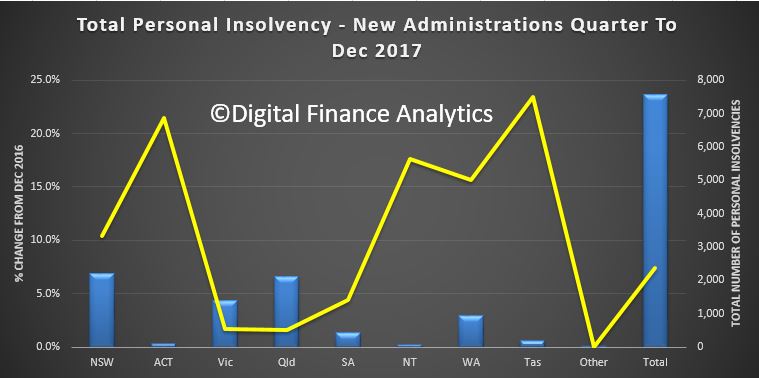
The latest data from The Australian Financial Security Authority, for the December 2017 quarter shows a significant rise in personal insolvency – a bellwether for the financial stress within the Australian community.
The total number of personal insolvencies in the December quarter 2017 (7,578) increased by 7.4% compared to the December quarter 2016 (7,055). This year-on-year rise follows a rise of 8.0% in the September quarter 2017.
Total personal insolvencies increased in all states and territories in the December quarter 2017, in year-on-year terms.
Quarterly total personal insolvencies remain below the historical peaks reached in 2008–09 and 2009–10 (more than 9,000 personal insolvencies).
The number of bankruptcies increased by 1.3% in year-on-year terms, from 3,976 in the December quarter 2016 to 4,029 in the December quarter 2017. This follows a 0.1% year-on-year rise in the September quarter 2017. Bankruptcies constituted 53.2% of total personal insolvencies, falling from 56.4% in the December quarter 2016.
The number of bankruptcies rose in year-on-year terms in the December quarter 2017 in all states and territories except Victoria, Queensland and South Australia.
In December quarter 2017, the number of debt agreements fell to 3,500 from the record high of 3,885 in the September quarter 2017.
In year-on-year terms, debt agreements rose by 15.3% from the December quarter 2016. This is the tenth consecutive quarter in which debt agreements have increased in year-on-year terms.
Debt agreements constituted 46.2% of total personal insolvencies, rising from 43.0% in the December quarter 2016.
Debt agreements increased in year-on-year terms in all states and territories in the December quarter 2017. Debt agreements in New South Wales reached a record quarterly high of 1,084 debt agreements in the December quarter 2017. There were 51 debt agreements in the Northern Territory (NT) in the December quarter 2017. Debt agreements in the NT also reached this record in the September quarter 2016.
Quarterly personal insolvency agreement levels fluctuate proportionally more than those of bankruptcies and debt agreements as levels are relatively small.
The number of personal insolvency agreements increased by 14.0% in the December quarter 2017 (49) compared to the December quarter 2016 (43).
This is the sixth consecutive quarter in which personal insolvency agreements have increased in year-on-year terms.
Housing in Australia is severely unaffordable, and despite the growth in jobs, unemployment in some centres is rising. We look at the evidence. Welcome the Property Imperative Weekly to 27th January 2018.
Thanks to checking out this week’s edition of our property and finance digest. Watch the video or read the transcript.
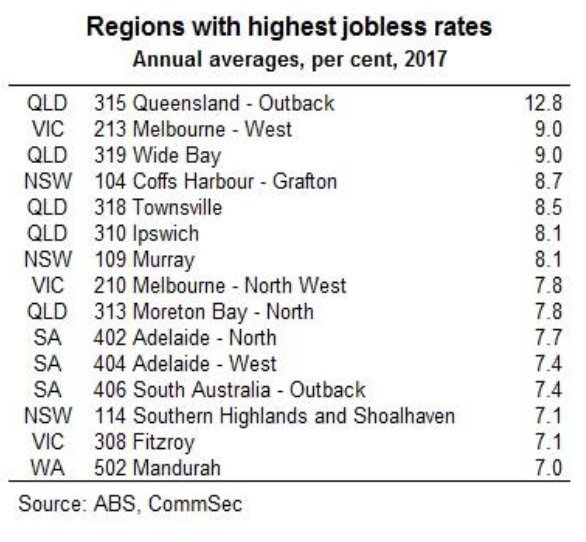
Today we start with employment data. CommSec looked at employment across regions over the last year. Despite the boom in jobs, the regional variations are quite stark, with some areas showing higher rates of unemployment, and difficult economic conditions. Unemployment has increased in several Queensland regional centres in recent years. Queensland’s coastal regional centres such as Bundaberg, Gympie, Bundaberg and Hervey Bay, known more broadly as Wide Bay (average 9.0 per cent), together with Townsville (albeit lower at 8.5 per cent) have elevated jobless rates. Unemployment also increased along the suburban fringes and city ‘spines’ such as Ipswich (8.1 per cent) in Brisbane and the western suburbs of Melbourne (9.0 per cent). In Western Australia, Mandurah, south of Perth, experienced a significant decline in the jobless rate to an average of 7.0 per cent in December from 11.2 per cent a year ago. Higher income metropolitan areas, especially in Sydney’s coastal suburbs, dominate the regions with the lowest unemployment rates. However, the corridor between Broken Hill and Dubbo has Australia’s lowest regional unemployment rate at 2.9 per cent, benefitting from agricultural, tourism and mining-related jobs growth. You will find there is a strong correlation with mortgage stress, as we will discuss next week.
The Victorian Government has reaffirmed their intent to shortly accept applications for its shared equity scheme known as HomesVic from up to 400 applicants. We do not think such schemes help affordability, they simply lift prices higher, but looks good politically. This was first announced in March 2017. The $50-million pilot initiative aims to make it easier for first-home buyers to enter the market by reducing the size of their loan, hence reducing the amount they need to save for a deposit. The initiative targets single first-home buyers earning an annual income of less than $75,000 and couples earning less than $95,000. Eligible applicants must buy in so-called “priority areas” which include 85 Melbourne suburbs, seven fringe towns and 130 regional towns and suburbs. In Melbourne, the list includes suburbs around Box Hill, Broadmeadows, Dandenong, Epping, Fishermen’s Bend, Footscray, Fountain Gate, Frankston, LaTrobe, Monash, Pakenham, Parkville, Ringwood, Sunshine and Werribee. Regional centres on the list include Ballarat, Bendigo, Castlemaine, Geelong, La Trobe, Mildura, Seymour, Shepparton, Wangaratta, Warrnambool and Wodonga. The state government said the locations were chosen in growth areas where there was a high demand for housing and access to employment and public transport. Some of these locations are where mortgage stress, on our modelling is highest – we will release the January results next week. The scheme is not available in most of Melbourne’s bayside suburbs, the leafy inner eastern suburbs or some pockets of the inner north.
Overseas, the US Mortgage Rates continue to rise, heading back to the worst levels in more than 9 months. Rates have risen an eighth of a percentage point since last week, a quarter of a point from 2 weeks ago, and 3/8ths of a point since mid-December. That makes this the worst run since the abrupt spike following 2016’s presidential election. While this doesn’t necessarily mean that rates will continue a linear trend higher in the coming months, the trajectory is up, reflecting movements in the capital markets, and putting more pressure on funding costs globally.
The Bank for International Settlements (BIS) has published an important report “Structural changes in banking after the crisis“. The report highlights a “new normal” world of lower bank profitability, and warns that banks may be tempted to take more risks, and leverage harder in an attempt to bolster profitability. This however, should be resisted. They also underscore the issues of banking concentration and the asset growth, two issues which are highly relevant to Australia. The report says that in some countries the 2007 banking crisis brought about the end of a period of fast and excessive growth in domestic banking sectors. Worth noting the substantial growth in Australia, relative to some other markets and of particular note has been the dramatic expansion of the Chinese banking system, which grew from about 230% to 310% of GDP over 2010–16 to become the largest in the world, accounting for 27% of aggregate bank assets.
Back home, an ASIC review of financial advice provided by the five biggest vertically integrated financial institutions (the big four banks and AMP) has identified areas where improvements are needed to the management of conflicts of interest. 68% of clients’ funds were invested in in-house products. ASIC also examined a sample of files to test whether advice to switch to in-house products satisfied the ‘best interests’ requirements. ASIC found that in 75% of the advice files reviewed the advisers did not demonstrate compliance with the duty to act in the best interests of their clients. Further, 10% of the advice reviewed was likely to leave the customer in a significantly worse financial position. This highlights the problems in vertically integrated firms, something which the Productivity Commission is also looking at. The real problem is commission related remuneration, and cultural norms which put interest of customers well down the list of priorities.
The Financial Services Royal Commission has called for submissions, demonstrating poor behaviour and misconduct. It will hold an initial public hearing in Melbourne on Monday 12 February 2018. The not-for-profit consumer organisation, the Consumer Action Law Centre (CALC) said the number of Aussie households facing mortgage stress has “soared” nearly 20 per cent in the last six months, and argued that lenders are to blame. Referencing Digital Finance Analytics’ prediction that homes facing mortgage stress will top 1 million by 2019, CALC said older Australians are at particular risk. The organisation explained: “Irresponsible mortgage lending can have severe consequences, including the loss of the security of a home. “Consumer Action’s experience is that older people are at significant risk, particularly where they agree to mortgage or refinance their home for the benefit of third parties. This can be family members or someone who holds their trust.” Continuing, CALC said a “common situation” features adult children persuading an older relative to enter into a loan contract as the borrower, assuring them that they will execute all the repayments. “[However] the lack of appropriate inquiries into the suitability of a loan only comes to light when the adult child defaults on loan repayments and the bank commences proceedings for possession of the loan in order to discharge the debt,” CALC said. We think poor lending practice should be on the Commissions Agenda, and we will be making our own submission shortly.
The latest 14th edition of the Annual Demographia International Housing Affordability Survey: 2018, continues to demonstrate the fact that we have major issues here in Australia. There are no affordable or moderately affordable markets in Australia. NONE! Sydney is second worst globally in terms of affordability after Hong Kong, with Melbourne, Sunshine Coast, Gold Coast, Geelong, Adelaide, Brisbane, Hobart, Perth, Cains and Canberra all near the top of the list. You can watch our separate video where we discuss the findings and listen to our discussion with Ben Fordham on 2GB. When this report comes out each year, we get the normal responses from industry, such as Australia is different or the calculations are flawed. I would simply say, the trends over time show the relative collapse in affordability, and actually the metrics are well researched.
Fitch Ratings published its Global Home Prices report. They say price growth is expected to slow in most markets and risks are growing as the prospect of gradually rising mortgage rates comes into view this year. Their data on Australia makes interesting reading. Fitch expects Sydney and Melbourne HPI to stabilise in 2018, due to low interest rates, falling rental yields, increasing supply, limited investment alternatives and growing dwelling completions, partially offset by high population growth. Fitch expects the increase in FTB to be temporary; low income growth, tighter underwriting and rising living costs will maintain pressure on affordability for FTB. As mortgage rates are currently low, any material rate rise will weigh further on mortgage affordability and serviceability. The rising cost of living and sluggish wage growth are likely to increase pressure on recent borrowers who have little disposable income. Fitch expects mortgage lending growth to slow to around 4% in 2018, based on continued record low interest rates and stable unemployment. This will once again be offset by continued underemployment, reduced investor demand and tougher lending practices.
Finally, the latest weekly data from CoreLogic underscores the weakness in the property market. First prices are drifting lower, with Sydney down 0.4% in the past week and Melbourne down 0.1%. The indicator of mortgage activity is also down, suggesting demand is easing as lending rules tighten. But then we always have a decline over the summer break. The question is, are we seeing a temporary blip, over the holiday season, or something more structural? We think the latter is more likely, but time will tell.
So that’s the Property Imperative Weekly to 27th January 2018. If you found this useful, do like the post, add a comment and subscribe to receive future editions. Many thanks for taking the time to watch.
Despite the boom in jobs, the regional variations are quite stark, with some areas showing higher rates of unemployment, and difficult economic conditions
There is also a correlation between employment and mortgage stress, more on this when we release our latest monthly stress update next week.
CommSec says:
Generally people in metropolitan areas earn higher incomes than their cousins in the country, but employment outcomes vary considerably.
Unemployment has increased in several Queensland regional centres in recent years. Outback Queensland, which includes western and far north areas of the state, has the worst unemployment rate in the country. That said, Cairns’ average unemployment rate has improved to 5.9 per cent in 2017 from 7.8 per cent a year ago.
Queensland’s coastal regional centres such as Bundaberg, Maryborough, Gympie, Bundaberg and Hervey Bay, known more broadly as Wide Bay (average 9.0 per cent), together with Townsville (albeit lower at 8.5 per cent) have elevated jobless rates. Manufacturing jobs in Wide Bay have declined by 1,306 between 2010 and 2016 according to Regional Development Australia.
The average unemployment rate in Coffs Harbour-Grafton on the NSW Mid-North Coast deteriorated to 8.7 per cent over 2017. Pleasingly, the actual unemployment rate fell to 6.1 per cent by year-end. Construction jobs have increased, underpinned by the $3.3 billion Pacific Highway upgrade between Port Macquarie and Coffs Harbour. A further 2,970 workers are expected to be employed on the $4.36 billion Woolgoolga to Ballina road upgrade.
Unemployment also increased along the suburban fringes and city ‘spines’ such as Ipswich (8.1 per cent) in Brisbane and the western suburbs of Melbourne (9.0 per cent). Around 950 jobs were lost at Holden’s Elizabeth factory in Adelaide’s north in October, pushing up the area’s unemployment rate to 7.7 per cent.
Higher income metropolitan areas, especially in Sydney’s coastal suburbs, dominate the regions with the lowest unemployment rates. However, the corridor between Broken Hill and Dubbo has Australia’s lowest regional unemployment rate at 2.9 per cent, benefitting from agricultural, tourism and mining-related jobs growth.
Melbourne satellite city Ballarat has experienced faster and younger population growth than its regional Victorian peers, supporting jobs growth. The unemployment rate in Ballarat has fallen to 4.1 per cent from 5.3 per cent over the year to December.
In Western Australia, Mandurah, south of Perth, experienced a significant decline in the jobless rate to an average of 7.0 per cent in December from 11.2 per cent a year ago. Mandurah has benefited from job-creating projects such as the Dwellingup National Trails Centre and Quambie Park aged care expansion.
When we talk about rental housing in Australia, we often make comparisons with renting overseas. Faced with insecure tenancies and unaffordable home ownership, we sometimes try to envisage European-style tenancies being imported here.
And, over the past year, there has been a surge of enthusiasm for developing a sector of large-scale institutional landlords, modelled on the UK’s build-to-rent sector or “multi-family” housing in the US.
Our review of the private rental sectors of ten countries in Australasia, Europe and North America identified innovations in rental housing policies and markets Australia might try to emulate – and avoid. International comparisons also give a different perspective on aspects of Australia’s own rental housing institutions that might otherwise be taken for granted.
Not everyone in Europe rents
In nine of the ten countries we reviewed, private rental is the second-largest tenure after owner-occupation. Only in Germany do more households rent privately than own their housing. Most of the European countries we reviewed have higher rates of home ownership than Australia.
In most of the European and North American countries in our study, single people and lower-income households and apartments are heavily represented in the private rental sector. Higher-income households, families with kids, and detached houses are represented much more in owner-occupation. It’s less uneven in Australia: more houses, kids and higher-income households are in private rental.
Two key potential implications follow from this.
First, it suggests a high degree of integration between the Australian private rental and owner-occupier sectors, and that policy settings and market conditions applying to one will be transmitted readily to the other.
So, policies that give preferential treatment to owner-occupied housing will also induce purchase of housing for rental, and rental housing investor activity will directly affect prices and accessibility in the owner-occupied sector.
It also heightens the prospect of investment in both sectors falling simultaneously, with little established institutional capacity for countercyclical investment that makes necessary increases in ongoing supply.
A second implication relates to equality. Australian households of similar composition and similar incomes differ in their housing tenure – and, considering the traditional value placed on owner-occupation, this may not be by choice.
This suggests housing tenure may figure strongly in the subjective experience of inequality. It raises the question of whether housing is a primary driver of inequality, and not the outcome of difference or inequality in other aspects of life.
The rise of large corporate landlords
In almost all of the countries we reviewed, the ownership of private rental housing is dominated by individuals with relatively small holdings. Only in Sweden are housing companies the dominant type of landlord.
However, most countries also have a sector of large corporate landlords. In some countries, these landlords are very large. For example, America’s five largest corporate landlords own about 420,000 properties in total. Germany’s largest landlord, Vonovia, has more than 330,000 properties alone.
These landlords’ origins vary. Germany’s arose from massive sell-offs of municipal housing and industry-related housing in the early 2000s.
In the US, multi-family (apartment) landlords have been around for decades. And in the aftermath of the global financial crisis, they have been joined by a new sector of single-family (detached house) landlords that have rapidly acquired large portfolios from bulk purchases of foreclosed, formerly owner-occupied homes.
In these countries and elsewhere, the rise of largest corporate landlords has been controversial. Germany’s have a poor record of relations with tenants – to the extent of being the subject of popular protests in the 2000s – and their practice of characterising repairs as improvements to justify rent increases.
American housing advocates have voiced concern about “the rise of the corporate landlord” – especially in the single-family sector, where there’s some evidence that they more readily terminate tenancies.
These landlords also don’t build much housing. They are most active in renovating (for higher rents), merging with one another, and – especially in the US – developing innovative financial instruments such as “rental-backed securities”.
“Institutional landlords” are now a standing item on the Australian housing policy agenda. Considering the activities of large corporate landlords internationally, we should get specific about the sort of institutional landlords we really want, how we will get them, and how we will ensure they deliver desired housing outcomes.
Policymakers and housing advocates have, for years, looked to the community housing sector as the prime candidate for this role. They envisage its transformation into an affordable housing industry that works across the sector toward a wide range of policy outcomes in housing supply, affordability, security, social housing renewal and community development.
With interest in the prospect of build-to-rent and multifamily housing rising in the property development and finance sectors, there is a risk that affordable housing policy may be colonised by for-profit interests.
The development of a for-profit large corporate landlord sector may be desirable for greater professionalisation and efficiencies in the management of tenancies and properties. However, this should not come at the expense of a mission-oriented affordable housing industry that makes a distinctive contribution to housing outcomes.
Bringing it home
Looking at the policy settings in the ten countries, we found some surprising results and strange bedfellows.
For example, Germany – which has had a remarkably long period of stable house prices – has negative gearing provisions and tax exemptions for capital gains, much like Australia. But, in Australia, these policies are blamed for driving speculation and booming prices.
And while the UK taxes landlords more heavily than most other countries, it has the fastest-growing private rental sector of the countries we reviewed.
However, these challenging findings should not be taken to diminish the explanatory power or effectiveness of these settings in each country’s housing policy. Rather, they show the necessity of considering taxation and other policy settings in interaction with each other and in wider systemic contexts.
So, for example, Germany’s conservative housing finance practices, and regulation of rents, may mean the speculative potential of negative gearing and tax-free capital gains isn’t activated there.
Strategy in Australia for its private rental sector should join consideration of finance, taxation, supply and demand-side subsidies and regulation with the objective of making private rental housing outcomes competitive with other sectors.
Author: Chris Martin, Research Fellow, City Housing, UNSW

 This result highlights the ongoing disconnect between business confidence, and consumers who are still reeling from rising costs of living, flat incomes and high debt.
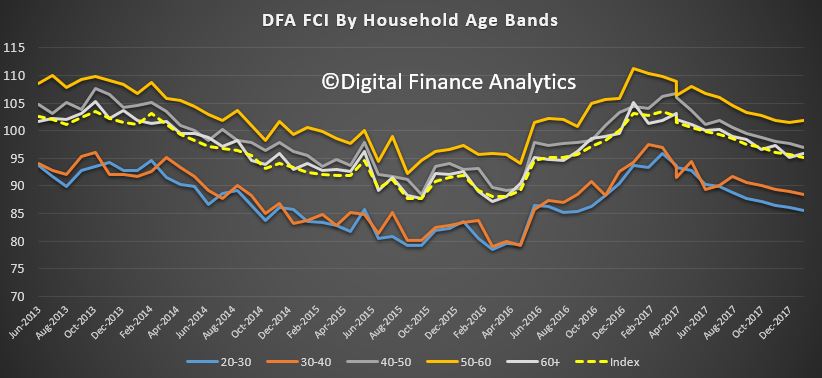 There was a significant drop in confidence in Victoria, which has now been overtaken again by New South Wales as the most confident state. Confidence fell in South Australia and Queensland, whilst there was little change in Western Australia, which recovered somewhat earlier in the year.
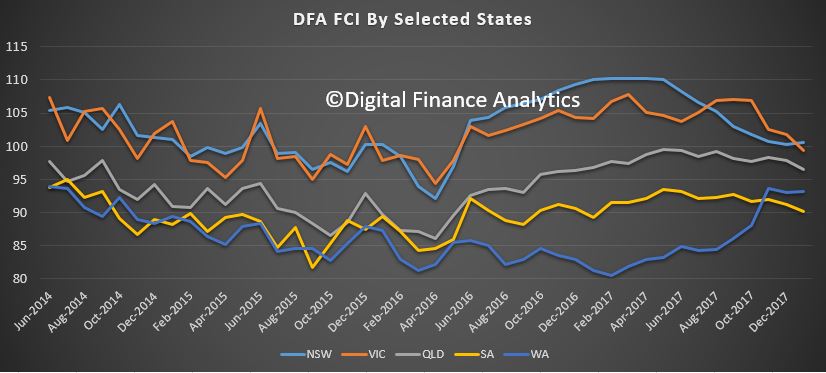 Household’s property footprint impacts confidence levels significantly, with those who are not property active and so living in rented accommodation sitting significantly below those who own property. Owner occupied property holders saw a small uplift this month, reflecting the lower refinancing rates available, and more first time buyers. However, property investors, traditionally the more bullish, continues to languish, dragging the whole index lower.
 The segmental scorecard shows that whilst job security rose a little, pressure from large levels of debt rose further, with 44% of households less comfortable than a year ago, and only 3% more comfortable. Pressure on savings continues, with lower returns on deposits, and more dipping into savings to pay the bills. 46% of households were less comfortable with their savings, compared with a year ago, and 4% only were more comfortable.
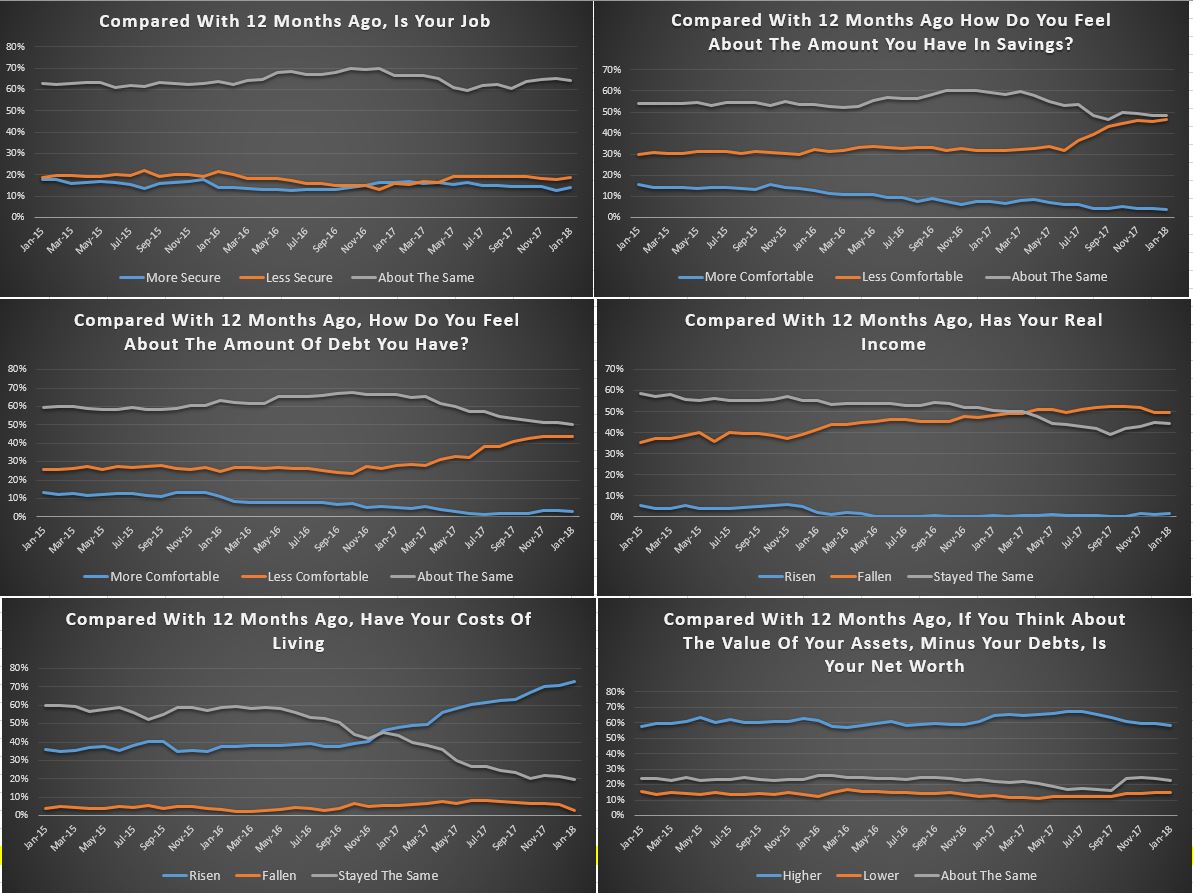 So, overall we see the ongoing slide in household financial confidence, and there is nothing on the horizon which is likely to change momentum. We expect wages growth to remain contained, and home prices to slide, while costs of living pressures continue to grow.