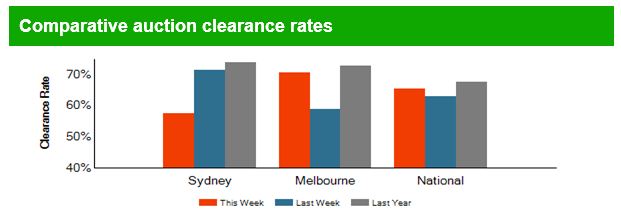
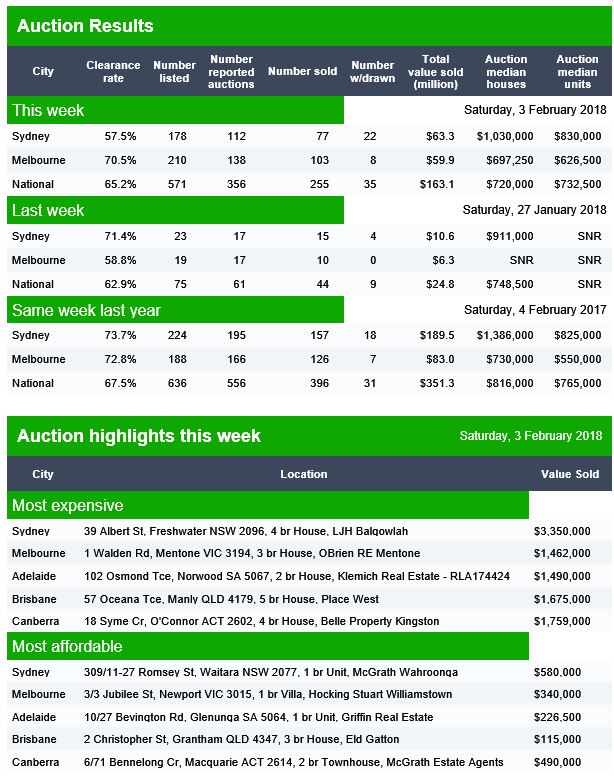
CoreLogic says the auction market is starting to bounce back from the seasonal slowdown, with almost three times the number of auctions held this week compared with last week, although volumes are lower than the same week last year. CoreLogic was tracking 779 auctions this week, compared with just 276 last week, while 881 homes were taken to auction this week last year.
Although the overall number of auctions is lower than this time last year, Melbourne was the only capital city to see an increase in volumes year-on-year. The preliminary auction clearance rate, based on the 578 auction results reported so far, was recorded at 67.7 per cent across the combined capital cities, compared to 72.8 per cent last week and 68.8 per cent last year.
All cities recorded a stronger preliminary clearance rate than what was recorded at the end of 2017, however, with auction activity only just starting to pick up, we should get a better idea over the coming weeks as to whether the clearance rates will revert back to the lower levels seen towards the end of last year.
ASIC has banned Michael Wilkins, of Watanobbi, NSW, from engaging in credit activities for three years.
Mr Wilkins was a mortgage broker and helped clients to arrange finance to purchase properties. ASIC found that on five occasions in June and July 2010, Mr Wilkins submitted loan applications on behalf of clients in which he deliberately overstated their savings by between about $130,000 and $179,000.
By submitting these loan applications, ASIC found that Mr Wilkins gave to the bank information or a document that was false or misleading.
Mr Wilkins has the right to appeal to the Administrative Appeals Tribunal for a review of ASIC’s decision.
So now we come to it. Australia’s future is totally locked into the housing market. If prices continue to fall (to begin to correct the massive over swing) , the macroprudential settings may be eased, and the RBA may cut the cash rate to stimulate the already over high household debt (200%).
Or in other words, once again the property sector becomes a political football. The question is does the “independent” RBA have the intestinal fortitude to resist the chorus. We simply have to get housing under control, as the longer term harm in not so doing will cripple us down the track .
In an AFR interview, the Treasurer signals that the macro-prudential lending controls could be eased.
Financial regulators may dial back home lending restrictions which have helped clamp down on rampant property price growth, if the recent slowdown in property values descends into sharper-than-anticipated falls, the federal Treasurer has signalled.
The government was “closely watching” the cooling residential real estate market Scott Morrison said.
Mr Morrison said he was meeting regularly with the Australian Prudential Regulation Authority – led by chairman Wayne Byres – and Reserve Bank of Australia – headed by governor Philip Lowe – to discuss the Council of Financial Regulators’ process.
The council, comprising the heads of APRA, RBA, the Australian Securities and Investments Commission and Mr Morrison’s Treasury Secretary, John Fraser, meets at least quarterly and is the guiding body informing APRA’s home lending rules for banks.
Mr Morrison said APRA’s restrictions over the past year to control lending to investors and to cap interest only loans had been “very effective” in achieving a “soft landing”.
But he signalled the rules were open to revision according to market conditions.
And elsewhere, Credit Suisse analysts are forecasting a large miss in Australian economic growth for the December quarter and residential investment could fall a lot sooner-than-expected if house prices weaken further, requiring a CUT in official interest rates. From Business Insider.
Credit Suisse analysts are forecasting a large miss in Australian economic growth for the December quarter.
And the recent housing downturn forms a central part of their analysis, as consumers reduce spending amid cooling house prices and other areas of the economy fail to pick up the slack.
The consensus forecast is for Q4 economic growth to come in around 0.9%, leaving annual growth in a range between 2.75% and 3.25%. The data is scheduled for release on March 7.
“We believe that the actual number is likely to come in south of 0.5%, taking year-ended growth below 2.4%,” Credit Suisse said.
The chart below shows the bank’s GDP tracker, which is pointing to softer growth in the near-term:
This chart shows each of the components Credit Suisse uses in the tracker to calculate its GDP forecasts:
“We remain of the view that without timely rate cuts, house prices are on an L-shaped trajectory, meaning that consumption and employment growth could slow sharply, while residential and infrastructure investment flatten out,” Credit Suisse said.
So when it comes to Australia’s near-term growth prospects and the outlook for interest rates, “much turns on the housing outlook”.
The analysts said the recent decline in foreign investment — along with tighter bank lending standards in the wake of the latest APRA restrictions — were two key factors in the recent house price-action.
“If the RBA is satisfied that eventually, foreign buying will return and banks will relax their lending standards, perhaps a short-term downturn is tolerable without cutting rates.”
“But if officials cannot see a recovery in house prices over the next few years, there is more urgency to cut rates, because the direct and indirect effects of housing weakness are too big to ignore.”
They noted the result was partly due to monthly volatility after a sharp rise in November, but said recent numbers are indicative of a broader downtrend.
“It appears that fundamentals are now re-asseting themselves. Consistent with past experience, building approvals are now coming off their highs with house prices, albeit with a slight delay.”
“The bad news is that residential investment could fall a lot sooner-than-expected if house prices weaken further.”
“This is over and above the negative wealth and credit effects on consumer spending from falling house prices.”
In view of that, it’s “hard to see a silver lining without rate cuts”.
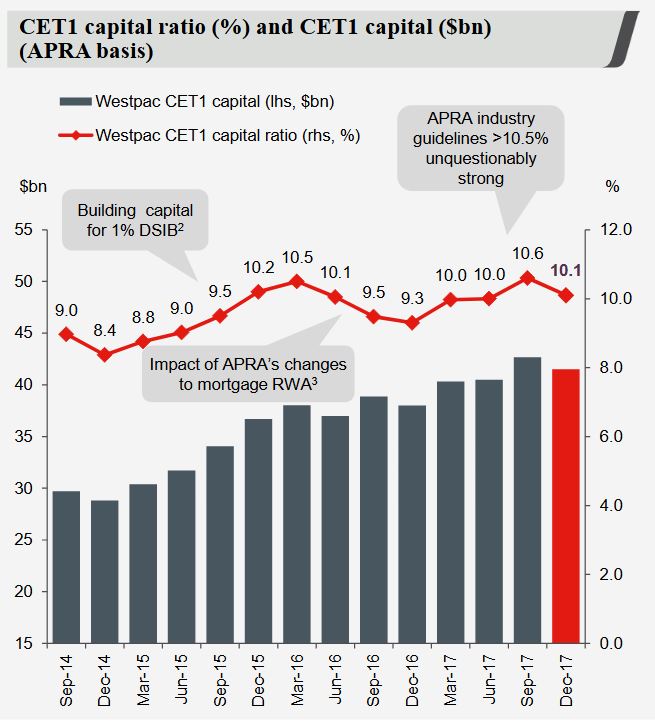
Westpac has released its December 2018 (1Q18) Pillar 3 update, which highlights a strong capital position, and overall benign risk of loss environment. They also provided some colour on Interest Only Loans.
They say that the Common equity Tier 1 (CET1) capital ratio 10.1% at 31 December 2017 down from 10.6% at September 2017. The 2H17 dividend (net of DRP) reduced the CET1 capital ratio by 70bps. Excluding the impact of the dividend, the CET1 ratio increased by around 20bps over the quarter.
Risk weighted assets (RWA) increased $6.1bn (up 1.5% from 30 September 2017) mainly in credit risk from changes to risk models and loan growth, partly offset by improved asset quality across the portfolio. Changes to risk models also contributed to an increase in the regulatory expected loss, which is a deduction to capital. Internationally comparable CET1 capital ratio was 15.7% at 31 December 2017, in the top quartile of banks globally.
Estimated net stable funding ratio (NSFR) was 110% and liquidity coverage ratio (LCR) was 116% which is well above regulatory minimums. They are well progressed on FY18 term funding, $15.4bn issued in the first four months. Westpac will seek to operate with a CET1 ratio of at least 10.5% in March and September under APRA’s existing capital framework and will revise its preferred range once APRA finalises its review of the capital adequacy framework.
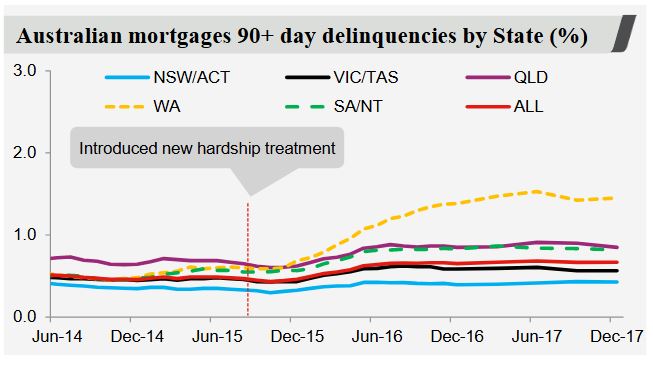
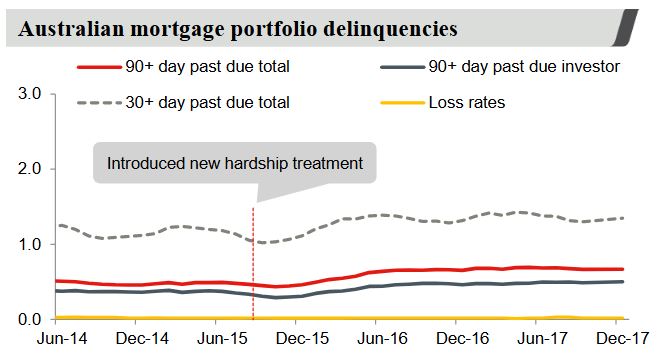
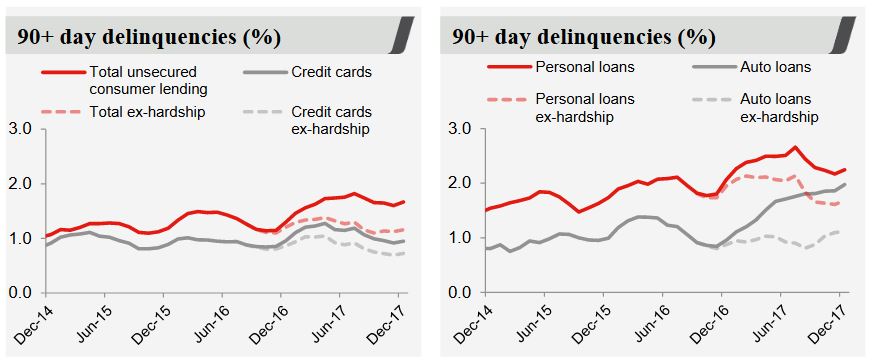
The level of impaired assets were stable with no new large individual impaired loans over $10m in the quarter. Stressed assets to TCE 2bps lower at 1.03%. Australian mortgage delinquencies were flat at 0.67%. Australian unsecured delinquencies were flat at 1.66%.
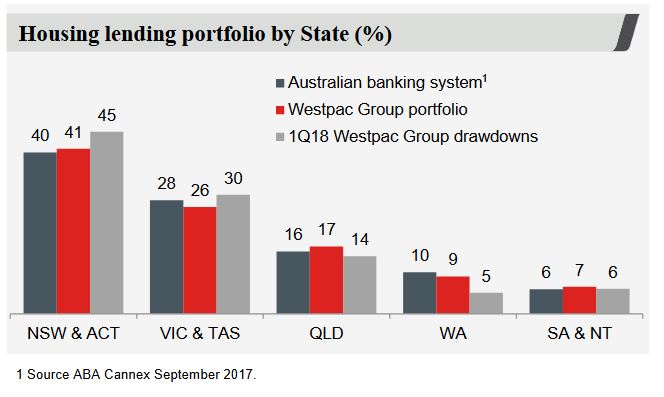
The bulk of mortgage draw downs are in NSW and VIC, with an under representation in WA compared with the market.
90+ day delinquencies are significantly higher in WA, compared with other states, reflecting the end of the mining boom.
There is a rise in delinquencies for personal loans and auto-loans, compared with credit card debt.
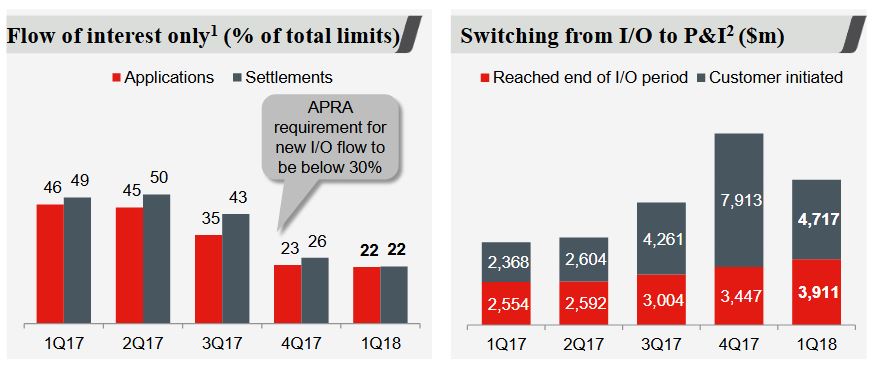
Flow of interest only lending was 22% in 1Q18 (APRA requirement <30%). Investor lending growth using APRA definition was 5.1% and so comfortably below the 10% cap.
They provided some further information on the 30% cap.
The 30% interest only cap incorporates all new interest only loans including bridging facilities, construction loans and limit increases on existing loans.
The interest only cap excludes flows from line of credit products, switching between repayment types, such as interest only to P&I or from P&I to interest only and also excludes term extensions of interest only terms within product maximums. Product maximum term for Interest only is 5 years for owner occupied and 10 years for investor loans.
Any request to extend term beyond the product maximum is considered a new loan, and hence is included in the cap.
So does that mean I could get an P&I loan, then subsequently switch it to an IO loan, so avoid the cap?
Also they highlighted key changes in their interest only mortgage settings.
Note that investors are paying more than owner occupiers, and interest only borrowers are paying even more!
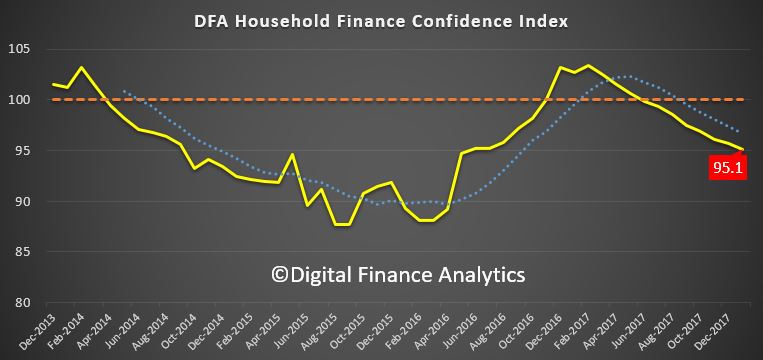
Digital Finance Analytics has released the January 2018 update of our Household Financial Confidence Index, using data from our rolling 52,000 household surveys.
The news is not good, with a further fall in the composite index to 95.1, compared with 95.7 last month. This is below the neutral setting, and is the eighth consecutive monthly fall below 100.
This result highlights the ongoing disconnect between business confidence, and consumers who are still reeling from rising costs of living, flat incomes and high debt.
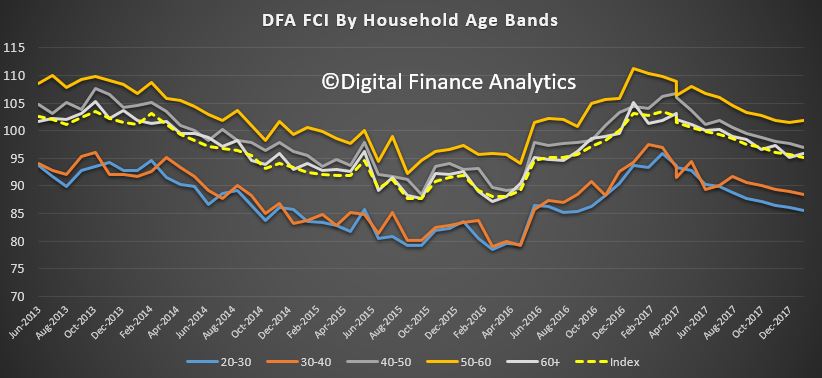
Across the age bands, there was a small rise in those older than 50 years, but younger households, from 20 -50 all tracked lower.
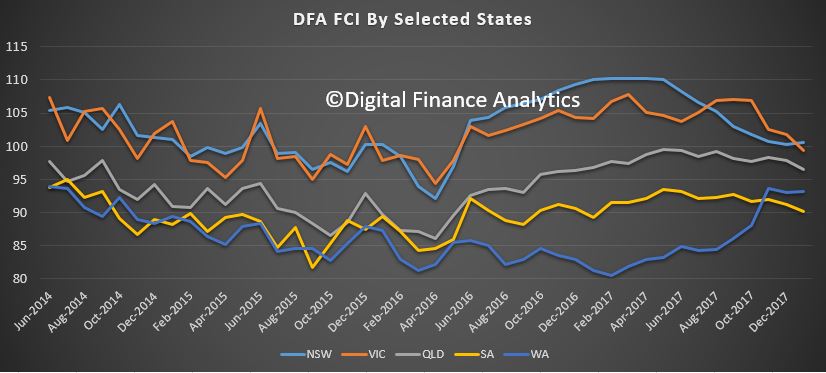
There was a significant drop in confidence in Victoria, which has now been overtaken again by New South Wales as the most confident state. Confidence fell in South Australia and Queensland, whilst there was little change in Western Australia, which recovered somewhat earlier in the year.
Household’s property footprint impacts confidence levels significantly, with those who are not property active and so living in rented accommodation sitting significantly below those who own property. Owner occupied property holders saw a small uplift this month, reflecting the lower refinancing rates available, and more first time buyers. However, property investors, traditionally the more bullish, continues to languish, dragging the whole index lower.
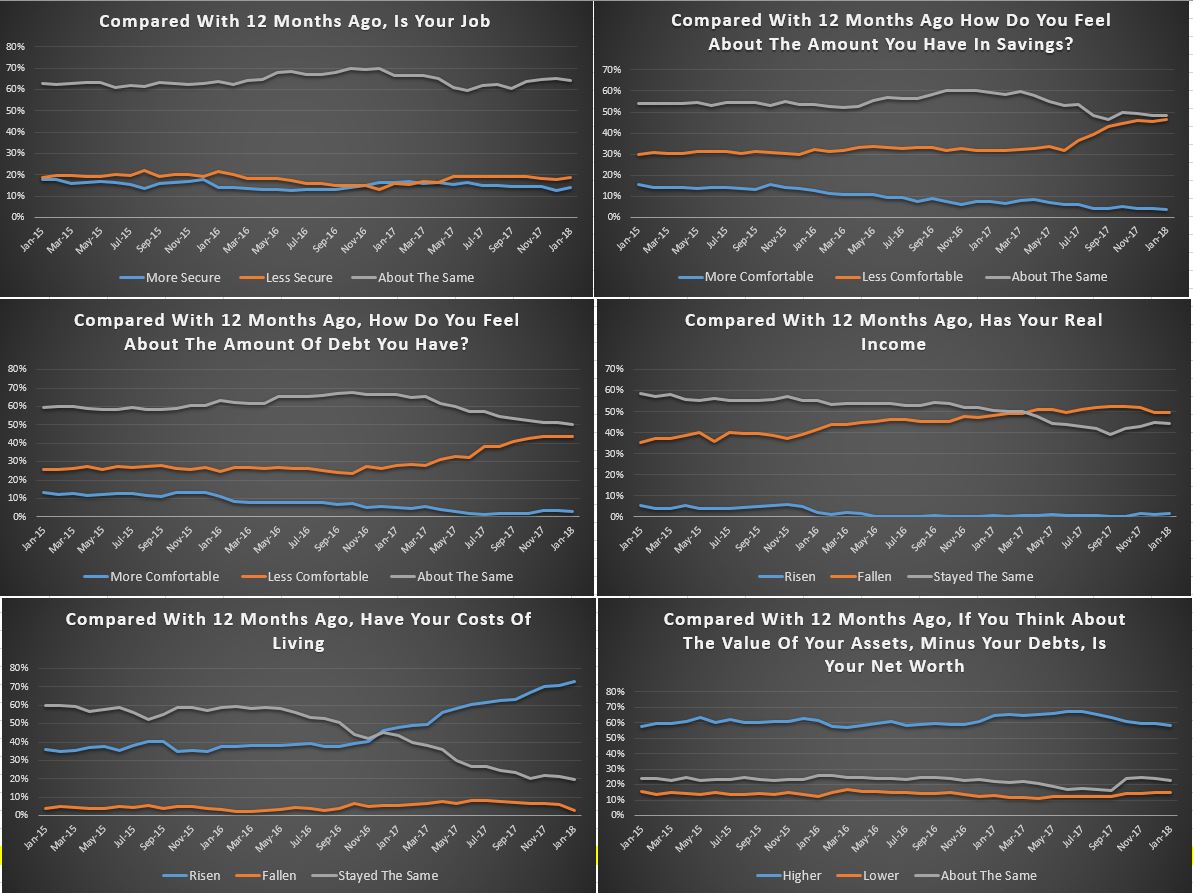
The segmental scorecard shows that whilst job security rose a little, pressure from large levels of debt rose further, with 44% of households less comfortable than a year ago, and only 3% more comfortable. Pressure on savings continues, with lower returns on deposits, and more dipping into savings to pay the bills. 46% of households were less comfortable with their savings, compared with a year ago, and 4% only were more comfortable.
Costs of living pressures are very real, with 73% of households recording a rise, up 1.5% from last month, and only 3% a fall in their living costs. A litany of costs, from school fees, child care, fuel, electricity and rates all hit home.
On the other hand, only 1% of households records a real rise in incomes compared with a year ago, while 50% said their real incomes had been eroded, and 45% stayed the same. More evidence that incomes are rising more slowly than costs. Those employed in the private sector are particularly hard hit, with many recording no pay rises for the past 2 years.
Finally, household net worth is under pressure for some, as property prices slide, and savings are being eroded (despite high stock market prices). Whilst 58% said wealth had improved, 15% recorded a fall, and 23% said there was no change. A further fall in property prices was the overwhelming concern of those holding real-estate, with more than half now expecting a fall in the months ahead. This expectation is already impacting their spending patterns, and have reduced their prospect of buying more property.
So, overall we see the ongoing slide in household financial confidence, and there is nothing on the horizon which is likely to change momentum. We expect wages growth to remain contained, and home prices to slide, while costs of living pressures continue to grow.
By way of background, these results are derived from our household surveys, averaged across Australia. We have 52,000 households in our sample at any one time. We include detailed questions covering various aspects of a household’s financial footprint. The index measures how households are feeling about their financial health. To calculate the index we ask questions which cover a number of different dimensions. We start by asking households how confident they are feeling about their job security, whether their real income has risen or fallen in the past year, their view on their costs of living over the same period, whether they have increased their loans and other outstanding debts including credit cards and whether they are saving more than last year. Finally we ask about their overall change in net worth over the past 12 months – by net worth we mean net assets less outstanding debts.
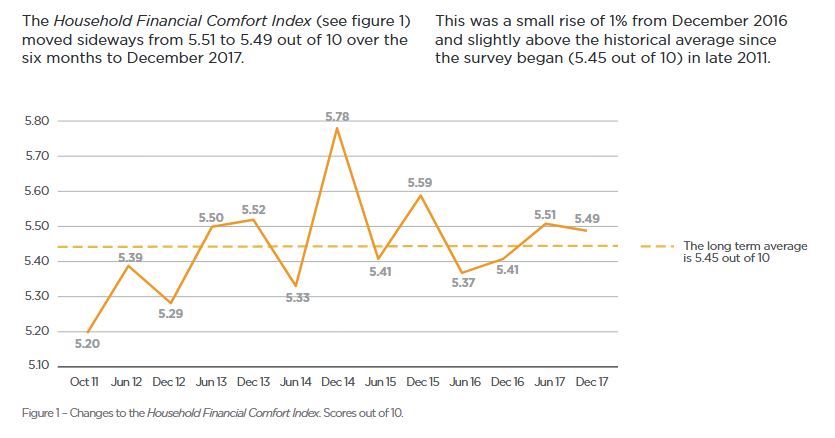
Despite improved job conditions and households reporting healthier financial buffers, the overall financial comfort of Australians is not advancing, according to ME’s latest Household Financial Comfort Report.
In its latest survey, ME’s Household Financial Comfort Index remained stuck at 5.49 out of 10, with improvements in some measures of financial comfort linked to better employment conditions – e.g. a greater ability to maintain a lifestyle if income was lost for three months – offset by a fall in comfort with living expenses.
“Households’ comfort with paying their monthly living expenses fell 3% to 6.40 out of 10 during the six months to December 2017, the lowest it’s been since mid-2014,” said Jeff Oughton, ME consulting economist and co-author of the report.
“In fact, ME’s latest report shows many households’ financial situation is getting worse and again the culprit is living expenses, with 40% reporting this as a key reason their situation is worsening.
“Around 46% of households surveyed also cited the cost of necessities such as fuel, utilities and groceries as one of their biggest worries.
“It’s unsurprising households are still feeling the pinch, given subdued income growth and the rising costs of energy, childcare, education and health.
“If it wasn’t for a decline in comfort with monthly living expenses, the report’s overall Household Financial Comfort Index would’ve likely increased,” said Oughton.
“The rising cost of necessities is currently holding Australians back when it comes to their finances.”
Oughton said that over the past year, 16% of households were not always able to pay their utility bills on time, while 19% sought financial help from family or friends and 13% pawned or sold something to buy necessities – a clear illustration of bill stress, particularly for those on lower incomes.
In other findings from the ABS, childcare costs have doubled in the past six years, while the cost of primary and secondary education has increased by 50%.
But Oughton said one household group of Australians is bucking the trend.
“Households under 35 years old without children – commonly dubbed the ‘avocado generation’ − many of whom have benefited from improved employment conditions without the burden of childcare costs or potentially a mortgage, are not as worried. Their financial comfort rose by 8%, and their comfort with living expenses increased 2% during 2017.”
Oughton said the report’s most encouraging result was households’ improved ability to maintain a lifestyle, if income was lost for three months, which rose 3% to 4.82 out of 10 in the past six months to December 2017 – its highest outcome since 2015. This finding reflects stronger labour market conditions, although mainly among full-time workers.
Victorians’ comfort plummets, while NSW’s rises
Household financial comfort in Victoria dropped significantly below New South Wales’ financial comfort for the first time since the survey began in 2011.
New South Wales improved by 3% in the past six months to 5.83 out of 10 in December 2017, the highest in three years, while Victoria fell 7% to 5.30 out of 10, its lowest level in the past six years.
“New South Wales’ superior financial comfort can be linked to greater confidence in handling a financial emergency (loss of income for three months) – a reflection of healthier employment conditions in the state,” said Oughton.
“Meanwhile, Victoria’s decline can be attributed to falls across most key drivers of financial comfort, including lower confidence in handling a financial emergency (loss of income for three months) and less comfort with investments.
“The discrepancy between the two states is significant given both have traditionally felt similar levels of comfort in the past,” added Oughton.
High levels of mortgage payment stress – set to worsen
More than half of households (56%) renting or paying off a mortgage reported they are contributing over 30% of their disposable household income towards this cost – a common indicator of financial stress – with 72% of renters spending 30% or more of their disposable income on rent and 46% of those paying off a mortgage putting 30% or more of their disposable income towards this.
Furthermore, the proportion of households who ‘worried about their household’s level of debt over the last month’ increased by 1 point to 38%. This proportion increased to 51% among mortgage holders, compared to 27% with no mortgage and 23% who own their own home outright.
“Seven per cent of households reported they could not always pay their mortgage on time during the past year, and 7% could not pay their rent on time.”
“Mortgage defaults may escalate if interest rates increase, particularly among vulnerable low-income households already dealing with the rising cost of necessities,” said Oughton.
The gap between Australia’s rich and poor continues to widen
A disparity in financial comfort between some household groups remain, with 30% of households reporting their financial situation worsened in the past year, while 35% reported it remained the same and 35% reported it improved.
“Around 61% of households with ‘low levels of comfort’ reported a significant worsening in their overall financial situation during 2017, while almost 70% of households on ‘high levels of comfort’ reported that their financial comfort improved during 2017. In other words, the rich are getting richer and the poor are getting poorer,” said Oughton.
Hardest hit were households with incomes below $40,000, 45% of which said their financial situation had worsened, as well as single parents and baby boomers, 36% of which reported their situation had worsened.
For the third consecutive report, disparity was also evident in household income improvements, with more than 50% of those earning over $100,000 reporting income gains while only 29% of those earning between $40,001 and $75,000 reporting income gains.
“Despite continued improvement in the labour market and general economic conditions, the benefits are not trickling down to many households. For these households it will only get worse as the cost of necessities keeps going up,” added Oughton.
Other findings
SA still feeling the pinch: Household financial comfort in South Australia fell by 4% to 5.00 out of 10 during the past six months, to remain the lowest of the mainland states.
WA and QLD continue to trend higher: Comfort in both Western Australia and Queensland remained broadly unchanged at 5.49 and 5.39 out of 10 respectively. Both resource-dominated regions are recovering from the mining downturn to be more in line with the level of household financial comfort reported across Australia as a whole.
The Household Financial Comfort Report is based on a survey of 1,500 Australians conducted by DBM Consultants in December 2017. The Report is produced every six months, with the first survey conducted in October 2011.
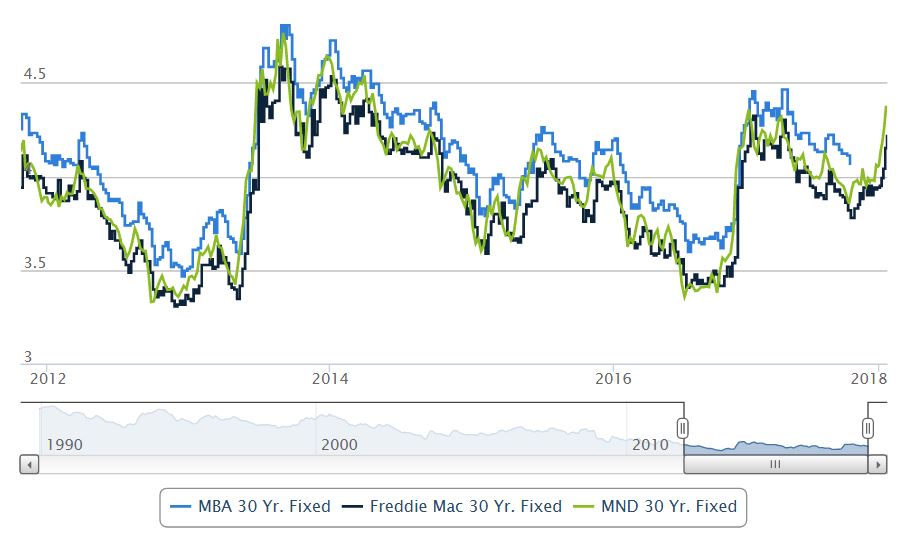
If you thought yesterday was bad for mortgage rates, you’re probably not going to be a big fan of today either. And since today is the end of a week, we could similarly say you won’t like this week if you didn’t like the previous example. That’s been true all year so far. And hey! Those week’s add up to a month (we’ll give yesterday and today a pass and consider them to be in the first month of 2018) so we can also say if you didn’t like the last month of 2017, you’re really going to hate the first month of 2018.
So what’s going on? Nothing outside the ordinary. The only problem is that “the ordinary” has involved bond market participants looking for almost every opportunity to sell bonds, thus pushing rates higher. Today’s focal point was the big jobs report in the morning. This data traditionally packs a big punch but it hasn’t been a big market mover recently. That appeared to change today, but the rate spike had more to do with the fact that traders were intent on pushing rates higher anyway and simply waiting to make sure the jobs data didn’t throw a wrench in the works. Granted, there was no way to know this would happen before it happened, but in any event, our default stance has been to assume rates will continue higher until they give us clear evidence to the contrary. Needless to say, we’re nowhere close to amassing any such evidence after days like today.
Rates are now officially at the highest levels in more than 4 years. The average lender is in the mid 4 percent range when it comes to quoting conventional 30yr fixed rates for well-qualified borrowers.
The implementation of a new accounting standard that changes the way banks reserve for loan losses could have a far more punitive impact on community banks than their larger counterparts.
The accounting standard, known as the current expected credit loss model, or CECL, becomes effective for many institutions in 2020 and will require banks to set aside reserves for lifetime expected losses on the day of origination.
The new standard will mark a considerable shift in how banks currently reserve for losses. Today, banks record losses when it becomes probable that a loan will be impaired. That means reserves are dispersed over time, but CECL will cause banks to significantly build their allowance for loan losses on the date of adoption, according to Josh Siegel and Ethan Heisler.
The two bank observers said in the latest Street Talk podcast that the increase will be even larger for institutions with higher concentrations of longer-term loans since reserves for those credits are currently spread out over longer periods.
“The same credit, the same view, the same company, if you have a two-year loan or a 20-year loan, the reserve you’re going to have to put it against it is dramatically different,” Siegel, managing partner and CEO of StoneCastle Partners LLC, an investor and adviser to community banks, said in the episode.
He said a reserve for a loan with a two-year term under CECL might not be dramatically different than the current methodology since it requires banks to look ahead 12 to 18 months for losses. Loans with far longer terms such as real estate credits, however, could require multiples of currently required reserves. The burden of the new accounting standard could prove far greater for community banks since those institutions are much more heavily concentrated in real estate.
Siegel and Heisler — president of the Bank Treasury Newsletter, which highlights industry trends impacting bank treasurers — co-authored a white paper analyzing CECL’s impact on banks with less than $50 billion in assets. The analysis found that hundreds of banks could be at risk of falling below well-capitalized status after adopting CECL, at least when it comes to meeting total risk-based capital requirements. Any reserve build required through CECL will be deducted from capital and could have the greatest impact on total risk-based capital ratios because the Basel III rules cap the inclusion of reserves at 1.25% of risk-weighted assets.
The required build under CECL could push reserves well above that level, according to Siegel and Heisler’s analysis. They examined the banking industry’s results since 2004 and assumed institutions adopted CECL beginning in 2005. The analysis further assumed that all loan portfolios had five-year terms, loans were originated at year-end and bankers were fully aware of the losses that would come between 2005 and 2016. The analysis assumed provisions equaled cumulative net charge-offs in the five years after adoption and considered a number of scenarios, with CECL implementation beginning in different years.
In the most severe scenario, where banks would have adopted CECL beginning in 2007, the analysis found that banks in aggregate would need as much as $70 billion to repair the capital shortfall. In the least severe scenario, with CECL adoption beginning in 2011, banks would need to raise close to $10 billion.
“It’s not just a small change. You could today be very well-capitalized and wake up and not even be adequately capitalized,” Siegel said. “You could be deemed undercapitalized and immediately be put under a cease and desist order.”
Siegel said banks should begin calculating CECL’s impact, even in a rough approximation, to see if they have a capital shortfall. For an institution falling short, they recommended that banks should consider issuing subordinated debt to bolster their balance sheets.
Siegel has encouraged community banks to utilize sub debt in the past, given that it allows banks with holding companies to raise funds, downstream them to their banking subsidiaries and count them as equity capital in far more cost-effective manner. He and Heisler noted that issuing sub debt today remains relatively cheap while interest rates continue to be low.
“Sub debt is a natural offset, a way to prepare for CECL,” Heisler said in the episode. “Think of Tier 2 sub debt almost as a CECL buffer.”
Domain have released their preliminary auction clearance results for today. Further evidence of a slowing market, especially in Sydney. More were withdrawn.
Brisbane cleared 57% of 71 scheduled auctions, Adelaide cleared 78% of 68 scheduled auctions, and Canberra 65% of 44 scheduled auctions.
The Home Price Crunch is happening now, but how low will prices go and which areas will get hit the worst? Welcome to the Property Imperative Weekly to 3rd February 2018.
Welcome to our digest of the latest finance and property news. Watch the video or read the transcript.
There was lots of new data this week, after the summer break. NAB released their Q4 2017 Property Survey and it showed that property dynamics are shifting. They see property prices easing as foreign buyers lose interest, and a big rotation from the east coast. Tight credit will be a significant constraint. National housing market sentiment as measured by the NAB Residential Property Index, was unchanged in Q4, as big gains in SA and NT and WA (but still negative) offset easing sentiment in the key Eastern states (NSW and VIC). Confidence levels also turned down, led by NSW and VIC, but SA and NT were big improvers. First home buyers (especially those buying for owner occupation) continue raising their profile in new and established housing markets, with their share of demand reaching new survey highs. In contrast, the share of foreign buyers continued to fall in all states, except for new property in QLD and established housing in VIC, with property experts predicting further reductions over the next 12 months. House prices are forecast to rise by just 0.7% (previously 3.4%) and remain subdued in 2019 (0.8%). Apartments will under-perform, reflecting large stock additions and softer outlook for foreign demand.
Both CoreLogic and Domain released updated property price data this week. It is worth comparing the two sets of results as there are some significant variations, and this highlights the fact that these numbers are more rubbery than many would care to admit. Overall, though the trends are pretty clear. Sydney prices are sliding, along with Brisbane, and the rate of slide is increasing though it does vary between houses and apartments, with the latter slipping further. For example, Brisbane unit prices have continued their downward slide, down to $386,000; a fall of 2.2 per cent for the quarter and 4.4 per cent for the year. Here units are actually at a four-year low. Momentum in Melbourne is slowing though the median value was up 3.2 per cent to $904,000 in the December quarter, according to Domain. Perth and Darwin remains in negative territory. Domain said Darwin was the country’s worst performer with a 7.4 per cent drop in its median house price to $566,000 and a 14 per cent plunge in its unit price to $395,000, thanks to a slowing resources sector. It also hit Perth, with a house median fall of 2.5 per cent to $557,000, and its units 1.7 per cent to $369,000. On the other hand, prices in Hobart and Canberra are up over the past year and Hobart is the winner, but is it 17% or 12%, a large variation between the two data providers? And is Canberra 8% or 4%? It depends on which data you look at. Also, these are much smaller markets, so overall prices nationally are on their way down. My take out is that these numbers are dynamic, and should not be taken too seriously, though the trend is probably the best indicator. Perhaps their respective analysts can explain the variations between the two. I for one would love to understand the differences. The ABS will provide another view on price movements, but not for several months.
The latest ABS data on dwellings approvals to December 2017 shows that the number of dwellings approved fell 1.7 per cent in December 2017, in trend terms, and has fallen for three months. Approvals for private sector houses have remained stable, with just under 10,000 houses approved in December 2017, but the fall was in apartments, especially in NSW and QLD. More evidence of the impact of the rise in current supply of apartments, and why high rise apartment values are on the slide. Also, the ABC highlighted the fact that Real estate sales companies are using big commissions to tempt mortgage brokers, financial planners and accountants to sell overpriced properties to unsuspecting clients. This is a way to offload the surplus of high-rise apartments, and looks to be on the rise, another indicator of risks in the property sector.
In other economic news, the ABS released the latest Consumer Price Index (CPI) which rose 0.6 per cent in the December quarter 2017. Annual inflation in most East Coast cities rose above 2.0 per cent, due in part to the strength in prices related to Housing. This follows a rise of 0.6 per cent in the September quarter 2017. However, there were some changes in methodology which may have impacted the results. Softer economic conditions in Darwin and Perth have resulted in annual inflation remaining subdued at 1.0 and 0.8 per cent respectively. Many commentators used this data to push out their forecast of when then RBA may lift the cash rate – but my view is we should watch the international interest rate scene, as this is where the action will be.
Whilst the FED held their target rate this week, there is more evidence of further rate rises ahead. Most analysts suggest 2-3 hikes this year, but the latest employment data may suggest even more. The benchmark T10 bond yield continues to rise and is at its highest since 2014, and now close to that peak then of about 3%. Have no doubt interest rates are on their way up. This will put more pressure on funding costs around the world, and put pressure on mortgage rates here. In fact Alan Greenspan, the former Fed Chair, speaking about the US economy said “there are two bubbles: We have a stock market bubble, and we have a bond market bubble”. “Irrational exuberance” is back! He said we’re working, obviously, toward a major increase in long-term interest rates, and that has a very important impact, on the whole structure of the economy. Greenspan said. As a share of GDP, “debt has been rising very significantly” and “we’re just not paying enough attention to that.” US rate hikes will lift international capital market prices, putting more pressure on local bank margins.
We published our latest mortgage stress research, to January 2018, Across Australia, more than 924,000 households are estimated to be now in mortgage stress compared with 921,000 last month. This equates to 29.8% of borrowing households. In addition, more than 20,000 of these are in severe stress, down 4,000 from last month. We estimate that more than 51,500 households risk 30-day default in the next 12 months, down 500 from last month. We expect bank portfolio losses to be around 2.7 basis points, though with losses in WA are likely to rise to 4.9 basis points. Some households have benefited from refinancing to cheaper owner occupied loans, giving them a little more wriggle room in terms of cash flow. The typical transaction has saved up to 45 basis points or $187 each month on a $500,000 repayment mortgage. You can watch our separate video blog on the results, where we count down the top 10 most stressed postcodes.
But the post code with the highest count of stressed households, once again is NSW post code 2170, the area around Liverpool, Warwick Farm and Chipping Norton, which is around 27 kilometres west of Sydney. There are 7,375 households in mortgage stress here, up by more than 1,000 compared with last month. The average home price is $815,000 compared with $385,000 in 2010. There are around 27,000 families in the area, with an average age of 34. The average income is $5,950. 36% have a mortgage and the average repayment is about $2,000 each month, which is more than 33% of average incomes.
We continue to see mortgage stress still strongly associated with fast growing suburbs, where households have bought property relatively recently, often on the urban fringe. The ranges of incomes and property prices vary, but note that it is not necessarily those on the lowest incomes who are most stretched. Banks have been more willing to lend to these perceived lower risk households but the leverage effect of larger mortgages has a significant impact and the risks are underestimated.
The latest data from The Australian Financial Security Authority, for the December 2017 quarter shows a significant rise in personal insolvency – a bellwether for the financial stress within the Australian community. The total number of personal insolvencies in the December quarter 2017 was 7,578 and increased by 7.4% compared to the December quarter 2016. This year-on-year rise follows a rise of 8.0% in the September quarter 2017.
This is in stark contrast to the latest business conditions survey from NAB. They say that the business confidence index bounced 4pts to +11 index points, the highest level since July 2017, perhaps driven by a stronger global economic backdrop and closes the gap between confidence and business conditions. Business confidence is strongest in trend terms in Queensland and SA and to a lesser extent NSW. Confidence is also reasonable in WA, and is in line with business conditions in the state. Victoria and Tasmania meanwhile are reporting levels of confidence which are lower than their reported level business conditions. But the employment index suggests employment growth may ease back from current extraordinary heights.
The RBA credit aggregates data reported that lending for housing grew 6.3% for the 12 months to December 2017, the same as the previous year, and the monthly growth was 0.4%. Business lending was just 0.2% in December and 3.2% for the year, down on the 5.6% the previous year. Personal credit was flat in December, but down 1.1% over the past year, compared with a fall of 0.9% last year. This is in stark contrast to the Pay Day Loan sector, which is growing fast – at more than 10%, as we discussed on our Blog recently (and not included in the RBA data). Investor loans still make up around 36% of all loans, and a further $1.1 billion of loans were reclassified in the month between investment and owner occupied loans, and in total more than 10% of the investor mortgage book has been reclassified since 2015.
The latest data from APRA, the monthly banking stats for ADI’s shows a growth in total home loan balances to $1.6 trillion, up 0.5%. Within that, lending for owner occupation rose 0.59% from last month to $1.047 trillion while investment loans rose 0.32% to $553 billion. 34.56% of the portfolio are for investment purposes. The portfolio movements within institutions show that Westpac is taking the lion’s share of investment loans (we suggest this involves significant refinancing of existing loans), CBA investment balances fell, while most other players were chasing owner occupied loans. Note the AMP Bank, which looks like a reclassification exercise, and which will distort the numbers – $1.1 billion were reclassified, as we discussed a few moments ago.
Standing back, the momentum in lending is surprisingly strong, and reinforces the need to continue to tighten lending standards. This does not gel with recent home price falls, so something is going to give. Either we will see home prices start to lift, or mortgage momentum will sag. Either way, we are clearly in uncertain territory. Given the CoreLogic mortgage leading indicator stats were down, we suspect lending momentum will slide, following lower home prices. We will publish our Household Finance Confidence Index this coming week where we get an updated read on household intentions. But in the major eastern states at least, don’t bank on future home price growth.
If you found this useful, do like the post, leave a comment or subscribe for future updates. By the way, our special post on Bitcoin will be out in the next few days, we have had to update it based on recent market gyrations.