Bank Australia sells its first sustainability bonds

On 20 August, according to Moody’s, Bank Australia Limited sold AUD125 million of three-year sustainability bonds, its first issuance of environment, social and governance (ESG) themed bonds. The bank plans to use the proceeds to finance, or refinance, green and social projects. Bank Australia’s ability to tap the growing demand for ESG investments is credit positive because it adds diversity to its funding sources and allows it to lengthen the overall maturity of its funding portfolio.

Bank Australia is a mutually owned bank that is primarily deposit-funded and must compete with larger commercial banks at a time when deposit growth has been slowing, but new liquidity regulations have incentivised banks to gather stable customer deposits. This has caused average deposit spreads to remain high.

The ability to diversify funding to include wholesale sources is therefore attractive. However, Bank Australia is a small mutually owned bank with a market share of 0.2%. Its limited scale means that, inevitably, investors will not have the same familiarity with its credit profile as Australia’s major banks, such as the Commonwealth Bank of Australia. This makes it more challenging and costly for Bank Australia to raise long-term funding in the senior unsecured market.

However, increasing investor interest in environmental and socially responsible investing has provided an opportunity for issuers like Bank Australia to tap longer-tenor wholesale funding in meaningful amounts.

A total of 60% of Bank Austalia’s AUD125 million sustainability bond issuance was allocated to investors with socially responsible investing (SRI) mandates or an ESG framework (Exhibit 2). The scale of investor demand also allowed the bank to increase its final issuance by 25% over the initial offer and to improve its pricing.

Other Australian issuers have also gained traction with bonds providing environmental and social benefits. Teachers Mutual Bank Limited, another small mutual bank, sold an ethical bond in June 2018. Demand has driven Australia’s issuance of green, social and sustainability bonds in the past four years at competitive spreads compared with regular issuance.

Following its sustainability bond issue, Bank Australia’s wholesale funding will increase to 12% from 10% of total funding, on a pro forma basis. Importantly, the sustainability bond, which has a tenor of three years, will lengthen the bank’s overall funding maturity profile.

Bank Australia will likely be able to issue further sustainability bonds in future, because of its involvement in social and environmental projects. For example, it makes loans for affordable housing, community housing, and disability housing.

We expect issuers’ increasing awareness of the benefits of issuing green, social and sustainability bonds to spur additional supply. There is some risk that issuance by larger banks may crowd out some small issuers like Bank Australia. However, any increase in issuance will build on a low base since these notes comprise only 2% of total issuance so far in 2018, according to financial market data collector Dealogic. Investor demand is also growing and is likely to absorb more supply.


US Boom Phase – What Next?

Mark Zandi, Chief Economist, Moody’s Analytics has penned an interesting piece suggesting that there is excessive risk taking among US corporate, as the business cycle moves past its zenith.  There are some worrying similarities between corporate leveraged lending and the subprime mortgage lending of the last crash.

The U.S. business cycle has entered its boom phase. This is a period that typically comes closer to the end of the cycle, just prior to a recession. It is characterized by robust economic growth, tightening labor and product markets, intensifying wage and price pressures, monetary tightening, and higher interest rates.

Another feature of the boom phase of a business cycle is excessive risk-taking somewhere in the financial system. This fuels the boom and is eventually at the center of the subsequent bust. Subprime mortgage loans were the obvious culprit a decade ago, runaway internet stocks that pumped up a stock market bubble were the problem in the early-2000s recession, and the savings and loan crisis incited the early 1990s downturn.

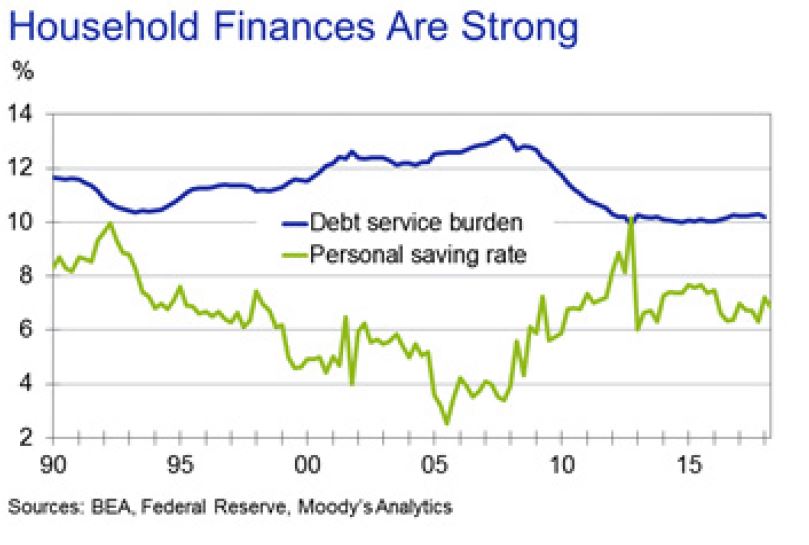
Risk-taking is clearly on the rise in this cycle, the aforementioned overvalued asset markets and easier underwriting are testimonial, but it is unclear precisely what might do this cycle in. There has been handwringing that households may be overborrowing again. But this concern seems overblown. Household credit growth is consistent with income gains, and debt loads that had fallen sharply after the last recession show no indication of rising. Debt service burdens remain low. And personal savings rates look ample after recent data revisions.

To be sure, vehicle and retail card lenders were extending too much credit not too long ago, and credit quality eroded. But lenders have since upped their standards, and delinquencies have peaked. Student loans are a problem, but not for the financial system, since the bulk of these loans are backed by the federal government. Student loans are thus a taxpayer problem, which could manifest itself in the next downturn by adding to the nation’s fiscal problems; policy makers will be under intense pressure to forgive and forbear on more of this debt.

Even so, worries that the nation’s ballooning budget deficits and debt load could do this cycle in are also overdone. They are a corrosive on growth as they push up long-term interest rates, but we are still a long way from U.S. Treasury bonds losing their safe-haven status to global investors. Municipal debt is more of an issue. But, while it will likely exacerbate the next recession, it won’t be the catalyst for it.

Leveraged lending

The most serious developing threat to the current cycle is lending to highly leveraged nonfinancial businesses. Across all businesses, borrowing appears manageable. The ratio of debt outstanding to GDP is about as high as it has ever been, yet this is a continuation of a long-running trend and reflects a broadening in the availability of credit to more businesses. The ratio of debt to business profits looks even more benign—largely unchanged since the early 1980s, abstracting from recessions when profits are hammered.

However, while businesses appear to be in good shape in aggregate, a significant number of highly leveraged companies are taking on sizable amounts of debt. This is evident in the rapid growth of socalled leveraged loans—loans extended to companies that already have considerable debt. These loans tend to have floating rates—typically Libor plus a spread—with a below-investment-grade (Baa or less) rating.

Leveraged loan volumes are setting records, and loans outstanding have increased at a double-digit pace over the past five years to nearly $1.4 trillion. Businesses use the loans to finance mergers, acquisitions and leveraged buyouts, followed by refinancing, and to pay for dividends, share repurchases and general expenses.

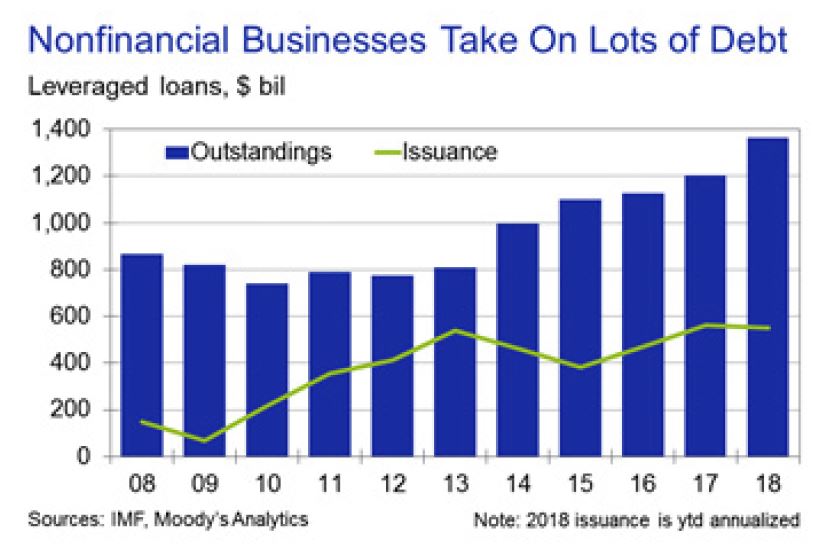
Powering leveraged lending is demand from the collateralized loan obligation market. CLOs are leveraged loans that have been securitized, and global investors can’t seem to get enough of them. This is clear from the thin spreads between CLO yields and comparable risk-free Treasuries.

Approximately one-half of leveraged loans currently being originated are packaged into CLOs, with CLO outstandings approaching $550 billion.

Easing underwriting

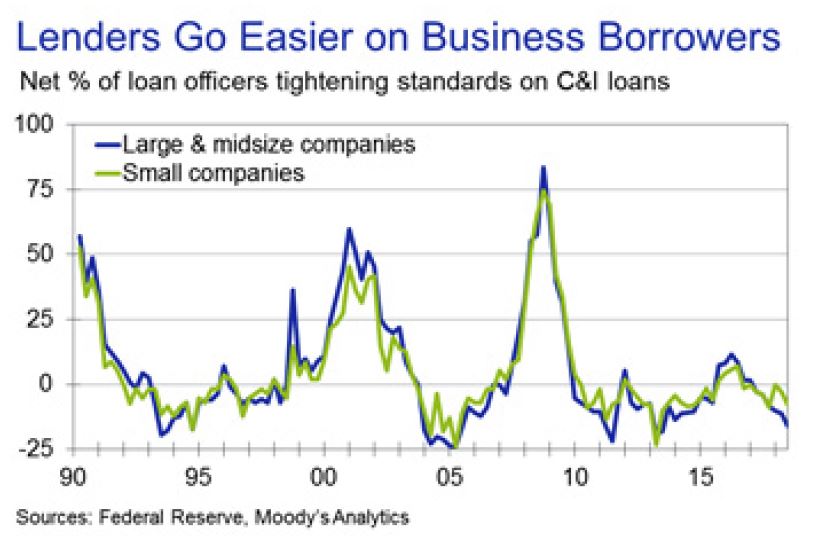
To meet the strong demand for leveraged loans from the CLO market, lenders are easing their underwriting standards. According to the Federal Reserve’s survey of senior loan officers at commercial banks, a net 15% of respondents say they lowered their standards on commercial and industrial loans to large and medium-size companies this quarter compared with the previous quarter. The only other time loan officers eased as aggressively on a consistent basis was at the height of the euphoria leading up the financial crisis in the mid-2000s. Standards for loans to small companies have not eased nearly as much, since they are much less likely to be bundled into a CLO.

Covenants on leveraged loans—restrictions on borrowers to ensure they can repay their loans—have also deteriorated, according to Moody’s Investors Service. The rating agency’s loan covenant quality indicator has fallen to its lowest level in its six-year history. Borrowers are negotiating greater flexibility to manage their balance sheets by moving or selling collateral, and they are increasingly able to sell collateral without using the proceeds to pay down their loans. It is becoming more unclear whether the collateral backstopping loans will be available in a bankruptcy.

The easing in underwriting is also evident in the below-investment-grade or junk corporate bond market.

The junk market hasn’t kept pace with the surging leveraged loan market, but it is nearly as big, with more than $1.3 trillion in outstandings. Here as well, bond covenants have eroded substantially in recent years, according to the rating agency, with the Moody’s bond covenant quality indicator currently hovering near record lows.

Eerie similarities

Considering the leveraged loan and junk corporate bond market together, highly indebted nonfinancial companies owe about $2.7 trillion. Their debts have been accumulating quickly as creditors have significantly eased underwriting standards. As interest rates rise, so too will financial pressure on these borrowers. Despite all this, global investors appear sanguine, as credit spreads in the CLO and junk corporate bond market are narrow by any historical standard.

Regulators are undoubtedly nervous—they issued guidance to banks to rein in their leveraged lending in 2013—but an increasing amount of the most aggressive lending is being done by private equity, mezzanine debt, and other institutions outside the banking system and regulators’ purview.

Now consider that subprime mortgage debt outstanding was close to $3 trillion at its peak prior to the financial crisis. Insatiable demand by global investors for residential mortgage securities drove the demand for subprime mortgages, inducing lenders to steadily lower their underwriting standards.

Subprime loans were adjustable rate, which became a problem in a rising rate environment as borrowers didn’t have the wherewithal to make their growing mortgage payments. Regulators were slow to respond, in part because they didn’t have jurisdiction over the more egregious players.

It is much too early to conclude that nonfinancial businesses will end the current cycle in the way subprime mortgage borrowers did the previous one. Even so, while there are significant differences between leveraged lending and subprime mortgage lending, the similarities are eerie.

UK housing market slowdown risks increasing loan severity

On Monday, Rightmove, a UK online real estate portal, reported that asking prices for UK homes for sale fell 2.3% in August from July, the largest decline since Rightmove began publishing such data, according to Moody’s.

The slowdown, which comes amid heightened uncertainty over Brexit, is credit negative for UK mortgage securitisations because it indicates a possible increase in loan severity as well as further delays in sales, as sellers seek to maximise prices and buyers wait for prices to fall further. The prospect of further house price declines, combined with recent tax increases and tightening underwriting criteria, will impel some buy-to-let landlords and borrowers under stress to sell their properties, resulting in further house price decreases.

In addition, a weaker housing market risks lessening borrowers’ willingness to repay their loans given that declining house prices reduce the equity in their properties. This could particularly affect regions with high average loan-to-value (LTV) ratios, such as London and the southeast, as well as the non-conforming mortgage market in general, since the average LTVs for non-conforming mortgages are typically higher than for prime or buy-to-let mortgages. However, the potential effect of decreasing house prices on borrowers is mitigated in the UK by lenders having full recourse to the borrower in case of default.

Uncertainty surrounding Brexit has increased the average time it takes to sell a property and increased the stock of properties being offered for sale throughout the UK, but particularly in London. The average time to sell a property in London increased by 13% in August from the same month last year, while in the UK as a whole it rose by 3.6%. Additionally, the number of UK properties under offer increased by 6% in August from the year-earlier period, signalling a slowdown in the sales process.

Following the changes in demand and supply, asking prices in London decreased by 1.2% between August 2017 and August 2018. This decline accelerated over the past month, with asking prices dropping by 3.1% compared with July 2018. The situation was less severe for the UK as whole, with prices dropping 2.3% during August, but increasing 1.1% from the same month last year.

The last significant house price drop in the UK was during the financial crisis (2007-08). However, the level of borrower indebtedness and the house price increases before the financial crisis were greater than in the run-up to the current house price decrease. Also, new origination has been more prudent from banks and building societies post crisis. Therefore, we would expect that any upcoming house price decrease would be smaller that during the previous financial crisis.

Australia’s proposals to improve comparability of bank capital are credit positive

The Australian Prudential Regulation Authority (APRA) has released a discussion paper proposing two options to improve the transparency, comparability and flexibility of Australia’s bank capital framework. Both options would be credit positive because each would improve the comparability of Australian banks’ capitalisation to global peers says Moody’s.

APRA’s proposals are not intended to change the quantum of bank capital, but to improve the comparability of reported capital ratios.

Australian banks’ reported capital ratios are generally lower than banks with comparable capital strength in other jurisdictions because of the regulator’s conservative implementation of Basel capital requirements. Banks using the internal ratings-based (IRB) approach to calculate capital ratios will be most affected. Investors’ better understanding of the true strength of Australian banks’ capitalisation will support the banks’ access to international capital markets where, in aggregate, they raise about two-thirds of their long-term debt. APRA’s first option would not change how Australian banks’ capital ratios are calculated. Instead, banks would use a regulator-endorsed methodology to report an additional “internationally comparable” ratio to facilitate comparison to global peers. This approach is broadly in line with current practice and IRB banks already disclose their own calculations of internationally comparable capital ratios, but the introduction of a regulator-endorsed methodology will add credibility and consistency to the calculation of the internationally comparable capital ratio.

APRA’s second option would remove aspects of conservatism in the definition of capital and banks’ calculation of risk-weighted assets (RWAs), making the calculation of capital ratios more consistent with global peers. Australian bank capital ratios would likely rise under this approach, so APRA would also lift minimum regulatory capital ratio requirements to ensure that banks retain the same level of capital. APRA also raised the possibility of increasing the size of the capital conservation buffer. APRA believes that increasing the spread before a bank’s capital ratio breaches this buffer will increase its capacity to begin a recovery action and for APRA to take supervisory action.

The key areas of conservatism within the current APRA capital framework largely relate to the calculation of RWAs. For example, APRA requires a minimum 20% loss-given-default assumption for residential mortgages, which is higher than in most jurisdictions. APRA also requires capital held at a Pillar I level for interest rate risk in the banking book, an approach that is not required under the Basel capital framework. The regulator’s definition of regulatory capital is also conservative in that it requires certain investments, tax assets and capitalized expenses to be deducted from capital.

To facilitate comparison to their global peers, Australia’s four major banks – Australian and New Zealand Banking Group Ltd., Commonwealth Bank of Australia, National Australia Bank Limited and Westpac Banking Corporation – have begun reporting their own calculations of internationally comparable Common Equity Tier 1 (CET1) capital ratios. On average, these self-reported ratios are 520 basis points higher than their headline regulatory CET1 ratio.

Conservative RWA calculations are the biggest driver of the differences between APRA and internationally comparable capital ratios Major Australian banks’ internationally comparable CET1 ratios are higher than APRA ratios

We note that APRA’s proposals come at time when other regulators are also proposing changes to their capital frameworks following the finalization of the Basel III capital rules by the Basel Committee. For example, Sweden’s regulator has proposed moving mortgages’ 25% risk-weight floor to Pillar I from Pillar II, which will increase RWAs and lower Swedish banks’ reported CET1 capital ratios. As a result, the difference between Australian bank capital ratios and their global peers may start to narrow, irrespective of APRA’s proposals. Depending on the outcome of a consultation on the discussion paper , APRA expects to release draft prudential standards in 2019 and finalise the standards by mid-2020.

Note: The bank ratings shown in this report are the bank’s deposit rating, senior unsecured debt rating and Baseline Credit Assessment

How Far Will U.S. Housing Momentum Ease?

From Moody’s

The U.S. housing market has garnered attention recently but for the wrong  reason amid numerous signs of some weakening. Parts of the housing market have likely peaked while others haven’t, including new-home sales and construction, which pack the biggest GDP and employment punch.

Source: Mortgage News Daily.

Before assessing where housing is headed, it’s important to identify the possible culprits in the recent weakness in sales and construction. Common theories being tossed around blame the tax legislation that reduced the incentive to be a homeowner by increasing the standard deduction, lowering the deduction for a new mortgage, and capping the deductible amount of state and local taxes (which include property taxes) at $10,000 per year. More time is needed to assess the law’s impact on housing, since evidence is lacking. Sales of higher-priced homes, which would be most vulnerable, have been climbing. The tax legislation’s drag on housing will likely play out by reducing home sales and pushing some households to rent instead of buy, potentially putting upward pressure on rents.

We believe that affordability issues, mainly mortgage rates, are a more credible reason for housing’s recent slump. Affordability is a function of house prices, mortgage rates and income. Earlier this year, we noted that there was evidence that the housing market’s sensitivity to mortgage rates is increasing. The recent weakness in housing is consistent with this, since past increases in mortgage rates have been sufficient enough to be a drag.

To assess the impact, we ran through our U.S. macro model a scenario of a permanent increase in mortgage rates of 1 percentage point in the first quarter. That would be roughly the average of the gain during the taper tantrum and following the presidential election. The results show that the hit to residential investment is noticeable over the course of the subsequent year; real residential investment would be 7% lower than the baseline —enough to shave 0.1 to 0.2 percentage point off GDP growth for the year.

So far, mortgage rates have risen by 60 basis points this year, so the hit is smaller than our exercise, but it supports our view that higher interest rates are hurting housing.

Though there are headwinds, new-home sales and construction haven’t peaked, as fundamentals remain supportive. To estimate the underlying demand for new housing units, we broke it up into its main components, the trend in household formations, demand for second homes, and scrappage or obsolescence. The biggest source of demand is household formations, which have been running around 1.3 million per annum recently and this should continue over the next couple of years.

Demand for second homes tends to grow with the total number of housing units. We estimate that demand is running around 200,000 per annum. Housing units are scrapped from the housing stock each year because of demolition, disaster and disrepair. We estimate scrappage at 200,000 per year.

Even though underlying demand for new housing units is 1.7 million,  housing starts should exceed that. Each year some housing units are started but never completed; assuming this is 1% of total housing starts—likely conservative—that would be an additional 17,000 starts. Underlying  demand is about 25% below housing starts in the first half of this year. To close this gap over the next two years, would require homebuilding to rise 15% per annum. However, given the constraints facing builders this is unlikely. Alternatively, closing the gap in four years would require  approximately an 8% gain per annum. Therefore, residential investment won’t be booming but it will be respectable.

CBA arranges world’s first bond issuance solely using blockchain, a credit positive

On 10 August, the International Bank for Reconstruction and Development said it has mandated the Commonwealth Bank of Australia (CBA) as the exclusive arranger of the world’s first bond issuance solely using blockchain technology, via Moody’s.

This is credit positive for CBA because it shows the bank is making headway with significant fintech initiatives, which can help improve its operating efficiency and fend off new competition.

CBA will use the private Ethereum blockchain platform to create, allocate, transfer and manage a new debt instrument debt, dubbed “bond-i.” The transaction will provide a platform for future debt-security issuance using blockchain technology. The use of blockchain for bond issuance can offer efficiency benefits for both issuers and arrangers by simplifying the settlement processes. The technology can be used for both registry and payment systems, consolidating payments by investors and title transfers by issuers into single, instant transactions.

Prior to this transaction, CBA experimented blockchain-based bond issuance with government entity Queensland Treasury Corporation (State of Queensland, Aa1 stable). In January 2017, the bank arranged the issuance of a so-called cryptobond for Queensland, by utilizing blockchain technology. It was a trial transaction carrying no debt obligation, with Queensland acting as both the issuer and investor to test the process.

As discussed in our Bank of the Future report, fintech innovations such as these will help traditional banks reduce operating costs and also mitigate the risk of disruption by new fintech firms

Moody’s Goes To Town On Interest Only Loans

We discuss the latest from Moody’s as they look at the rising risks in Interest Only (IO) loans.

Please consider supporting our work via Patreon ;

Please share this post to help to spread the word about the state of things….

Banking Strategy
Banking Strategy
Moody's Goes To Town On Interest Only Loans
Loading
/

Thousands of Aussies with interest-only mortgages set to struggle: Moody’s

The number of Australians falling behind on their mortgages will rise in the next two years as interest-only loans end and repayments get more expensive, ratings agency Moody’s has warned, via MSN.


Delinquencies on loans that have converted from interest-only to principal and interest are running at double the rate of those still on interest-only, Moody’s said in a report released on Thursday.

“When IO (interest-only) loans convert to P&I (principal and interest), borrowers have to make higher monthly repayments, and this ‘payment shock’ can lead to mortgage delinquencies and makes IO loans riskier than P&I loans,” Moody’s said.

Repayments jump by around 30 percent when mortgages convert to principal and interest, the agency said.

Currently, the delinquency rate for mortgages converted to principal and interest is 0.94 per cent – a rate also above the arrears rate for all mortgages.

“Refinancing interest-only mortgages is also becoming more difficult, which will in itself contribute to an increase in mortgage delinquencies,” the ratings agency said.

About 40 per cent of loans by Australian banks in 2014 and 2015 were interest-only for five years, meaning a large portion are set to come under pressure with higher repayments in 2019 and 2020, said Moody’s.

Moody’s report backs up findings from Digital Finance Analytics (DFA), which estimates that more than 970,000 Australian households are now believed to be suffering housing stress.

That equates to 30.3 percent of homeowners currently paying off a mortgage.

Of the 970,000 households, DFA estimates more than 57,100 families risk 30-day default on their loans in the next 12 months.

“We continue to see households having to cope with rising living costs – notably childcare, school fees and fuel – whilst real incomes continue to fall and underemployment remains high,” wrote DFA principal Martin North.

“Households have larger mortgages, thanks to the strong rise in home prices, especially in the main eastern state centres, and now prices are slipping.

“While mortgage interest rates remain quite low for owner-occupied borrowers, those with interest-only loans or investment loans have seen significant rises.”

Higher home loan rates in Australia are positive for small and midsize lenders

According to Moody’s , Australian regional banks Bendigo and Adelaide Bank  and Teachers Mutual Bank Limited increased their home loan rates.

This follows a number of other small and midsize banks that have recently raised their home loan rates, taking the total to 16. The increase in rates is credit positive for these banks because it will help preserve their net interest margins amid higher wholesale funding costs and slower loan growth.

In contrast, Australia’s four-largest banks – Australia and New Zealand Banking Group Corporation, Commonwealth Bank of Australia, National Australia Bank Limited and Westpac Banking Corporation – have yet to raise their lending rates amid intense political scrutiny and against the backdrop of a probe by Australia’s Royal Commission into Misconduct in the Banking, Superannuation and Financial Services Industry. Given that the four major banks have traditionally been the first-movers on headline home loan rates, we see smaller lenders’ willingness and ability
to increase rates as credit-positive evidence that they retain pricing power independent of the current challenges confronting the major banks.

To date, the rate increases have been concentrated in variable-rate home loan products, which are more popular in Australia than fixed-rate loans, at about 10 basis points for owner-occupier principal and interest loans, and higher for riskier products such as investor and interest-only loans.

Higher home loan rates will offset higher wholesale funding costs, with short-term funding costs being particularly affected.


Long-term debt issuance costs have increased proportionally less and, importantly, remain low by historical comparison. As such, the effect on banks’ weighted-average cost of long-term debt has thus far been muted. Positively, blended average deposit costs are marginally lower because banks have been paying lower rates on short-term deposits. The net effect varies by bank, according to various factors including their loan mix and funding profile. For instance, midsize listed banks have a moderately lower proportion of home loans and more short-term wholesale funding than smaller, predominantly mutual banks, which tend to have a higher concentration in home loans and are principally retail deposit-funded. As a consequence, the smaller banks may gain a little more profitability benefits from the latest round of rate increases. Following the rate increases, smaller banks still offer more favourable headline home loan rates than the major banks. However, the majors continue to offer significant discounts to attract the highest-quality borrowers at a time when system loan growth has slowed.

Despite the very high level of household leverage in Australia, we do not expect the current round of home loan rate moves to cause a sharp increase in loan delinquencies or credit costs. That is because labour market conditions, which are a strong indicator of mortgage performance, are likely to remain favourable, underpinned by solid economic growth forecasts. Additionally, the increases in home loan rates are small compared with the buffer built into home loan serviceability assessments. Australian lenders commonly assess borrowers’ repayment ability based on an interest rate floor of 7.25%, which is well above the average home loan rate of around 5.25% posted by Australian banks over the past three years. Moreover, collateral quality will remain strong, despite ongoing house price corrections in Sydney and Melbourne. The average loan-to value ratio for Australian bank home loan portfolios remains around 50%.

SEC’s New Dark Pools Rule Is Credit Positive – Moody’s

Moody’s says that last Wednesday, the US Securities and Exchange Commission adopted amendments to the rules governing alternative trading systems (dark pools) that will increase transparency around trading data and execution.

The new rule is credit positive because it will require dark pools to provide standardized and detailed public disclosures, enhancing their oversight. The new disclosures take effect January 2019.

The increased disclosure requirements will improve reporting and oversight by dark-pool operators, which are typically large banks and independent and specialized trading firms such as Liquidnet Holdings, Inc.  We expect these improvements to increase customer confidence in dark-trading venues, allowing customers to assess potential conflicts of interest or the potential for leakage of subscriber information from the dark pools to its broker-dealer operator or affiliates. The tougher reporting requirement standards will also strengthen dark pools’ internal oversight and compliance framework, which should limit future regulatory penalties, a credit positive.

Dark pools are a type of off-exchange trading venue that institutional investors actively use because they provide anonymous execution and minimize market effects. Dark-pool trades remain subject to national market system regulatory requirements, chief among them that trades must be executed at or better than the national best bid-offer price – the price that corresponds to the most competitive, publicly visible resting order on so-called bright venues such as exchanges. As of first quarter 2018, dark pools processed around 12% of all US equity trading volume

In recent years, the SEC and the New York Attorney General have scrutinized dark pools. Securities regulators investigated whether banks misled institutional investors participating in their dark pool trading venues and favored high frequency traders. A number of dark-pool operators agreed to settle charges relating to disclosure failures or other securities law violations. Most prominently in 2016, subsidiaries of Barclays Bank PLC (A2/A2 stable, baa31) and Credit Suisse AG (A1/A1 stable, baa2) agreed to settle separate cases. Barclays paid $70 million and Credit Suisse paid $84.3 million to resolve claims that their dark pools failed to continuously monitor the trading venues against predatory trading, to treat subscriber information confidentially and other disclosure shortfalls.

The new reporting requirements include the disclosure of information regarding ownership of a dark pool and its broker-dealer and arrangement between the dark pool and affiliate broker-dealers. A dark pool will also be required to disclose the type of subscribers it caters to, order types, fees and other operational information.