Westpac Net Interest Margins Take A Hit Of 11 Points

Westpac released their latest disclosures today the June 2018 Pillar 3 Report and provided an update on margins for the June quarter 2018. Its not pretty. Margins down, and mortgage delinquencies up.


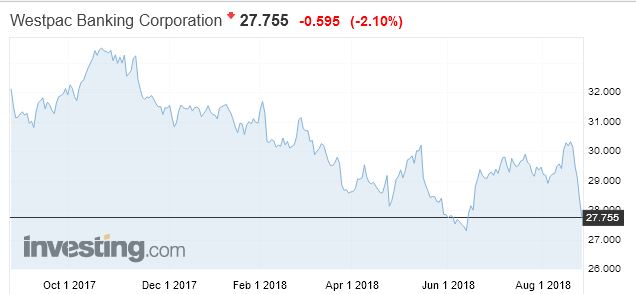
The share price continues lower.
Westpac Banking Corporation has today announced that its net interest margin in June quarter 2018 (3Q18) was 2.06% compared to 2.17% in First Half 2018 (1H18). The 11bp decline mostly reflected higher funding costs and a lower contribution from the Group’s Treasury.
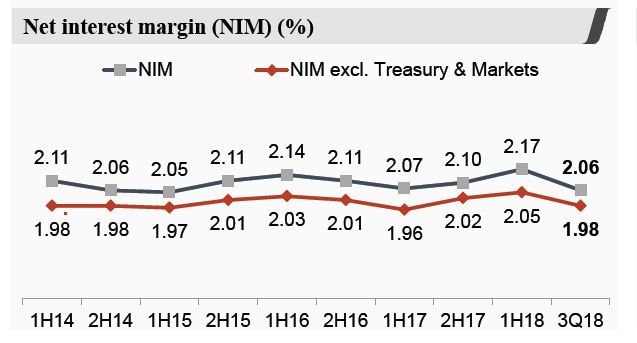
The primary source of higher funding costs has been the rise in short term wholesale funding costs as the bank bill swap rate (BBSW) increased sharply since February.

Westpac previously indicated that every 5bp movement in BBSW impacts the Group’s margins by around 1bp. Compared to 1H18, BBSW was on average 24bps higher in 3Q18. Accordingly, in 3Q18 this movement in BBSW reduced the Group’s net interest margin by 5bps.

The remaining 6bps margin decline in 3Q18 was attributable to:

  • 4bps from a reduced contribution from Group Treasury, principally from less opportunities in markets in 3Q18 compared to 1H18; and
  • 2bps from all other factors. These included ongoing changes in the mix of the mortgage portfolio (less interest only lending) along with lower rates on new mortgages. Deposit pricing changes only had a small impact on margins in 3Q18.

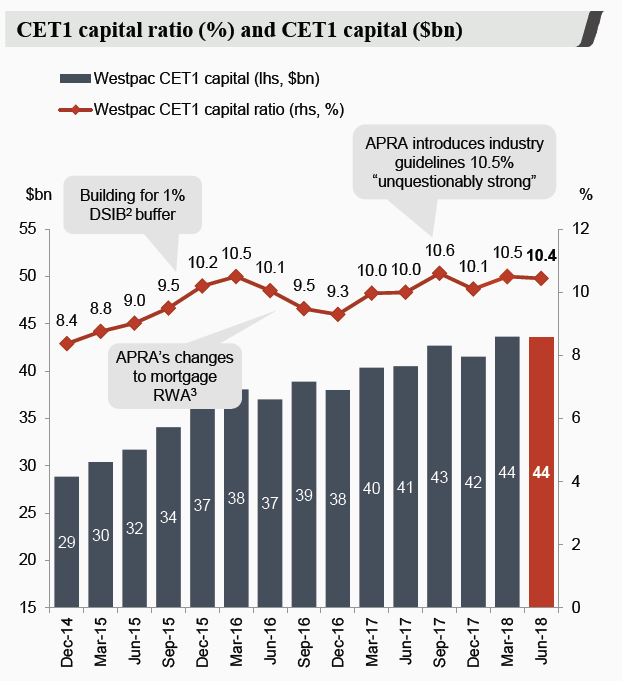
In Westpac’s June 2018 Pillar 3 report released today the Group reported a Common equity Tier 1 capital ratio of 10.4% at 30 June 2018. The ratio was lower than at 31 March 2018 as capital generated over the quarter was more than offset by determination of the First Half 2018 dividend.
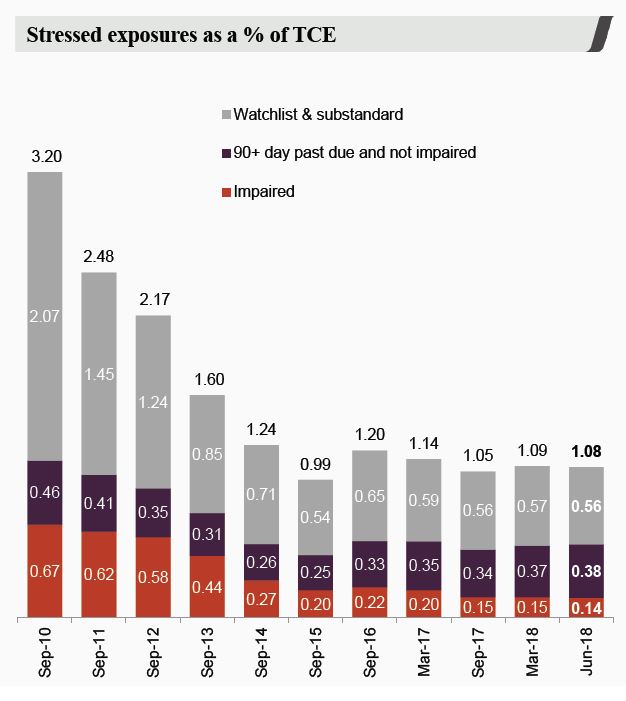
Credit quality has continued to be sound with stressed assets to total committed exposures down 1bp from 31 March 2018 to 1.08%.
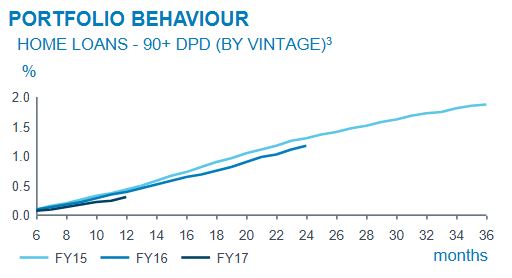
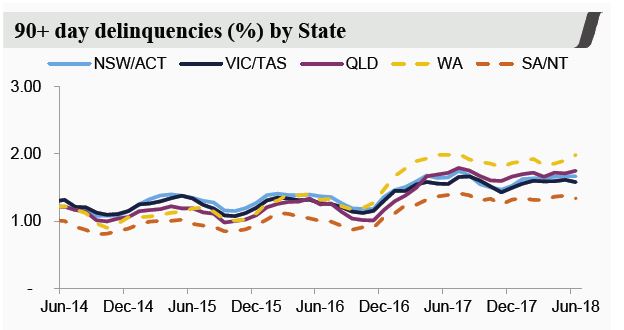
Mortgage 90+ day delinquencies in Australia were up 3bps over the three months ended June 2018 with most States recording some increase.
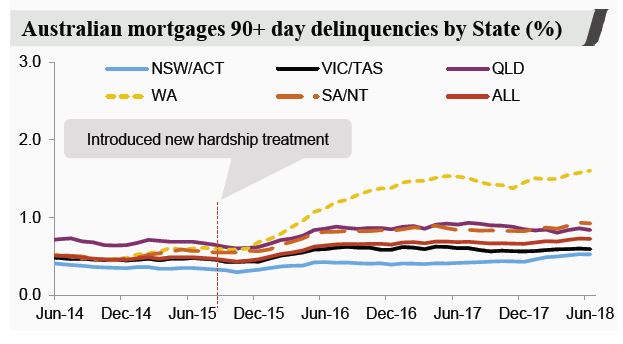
Mortgage 30+ day delinquencies were flat over 3Q18 while properties in possession were lower at just 392.

Unsecured consumer credit delinquencies rose.
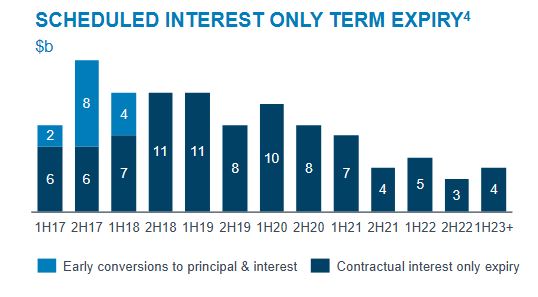
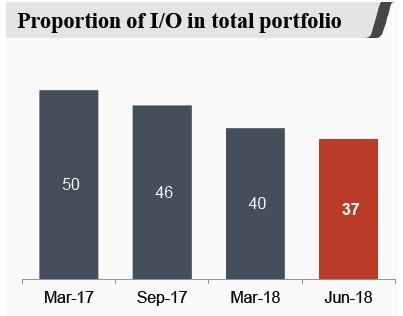
The proportion of interest only loans has dropped from 50% in March 17 to 37% in June 18. This had a 2 basis point impoact on margins.
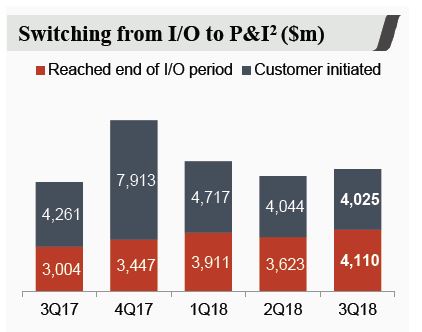
More than $8 billion of IO loans were refinanced to Principal and Interest in the 3Q18, with slightly more than half because they ended their term.

The Group has maintained strong liquidity metrics with the Net stable funding ratio of 112% and the Liquidity coverage ratio of 127%, both comfortably above regulatory minimums.

For the 10 months to 31 July 2018, the Group had raised $31bn in term wholesale funding at an average duration of over 6 years. This largely completes Westpac’s Full Year 2018 term funding requirements.

AFG FY2018 Profit Up 10.4%

AFG has announced its annual results for the 2018 financial year (FY2018). Strong organic growth has seen AFG deliver profit growth of 10.4% in FY2018, the company says.

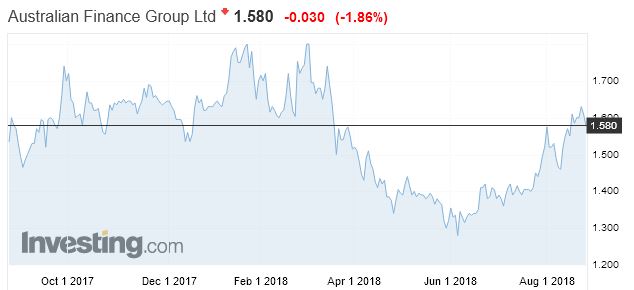
The share price has recovered in recent times, but remains below the highs of last year. It has dropped a little now.

The company reports an annual cash net profit of $33.3 million for the financial year ended 30 June 2018 and announces a final dividend of 5.7 cents per share fully franked, bringing total dividends for the year to 22.4 cents per share inclusive of the special dividend that was paid in March 2018. This represents a dividend yield of 15.9%.

AFG retains a strong balance sheet which remains debt free. In a relatively benign credit market, the growth in AFG’s profit is reflective of the strength of its distribution capability with residential settlements of $35.3 billion representing growth of 3%.

AFG CEO David Bailey said the company continues to successfully deliver earnings diversification through the core residential and commercial aggregation business and the higher margin AFG Home Loans business line.

“The earnings diversification strategy of AFGHL continues to deliver results for shareholders with settlements of $3.2 billion, up 20% on FY2017.

AFG’s strategic focus on the under-served SME market also saw the company acquire a significant stake in leading commercial SME lender Think Tank Group Pty Ltd (“Thinktank”) and continue to roll out its AFG Business platform.

“AFG continues to generate consistent growth in sustainable quality earnings despite challenging regulatory and economic conditions,” he said. “This would not be possible without AFG’s earnings diversification strategy, systemic importance to the Australian financial services industry, the certainty provided by a $145.4 billion loan book and distribution network of over 2,950 brokers across Australia.

Highlights include:

  • NPAT of $33.3 million, an increase of 10.4% on normalised FY17
  • AFG Home Loans settlements of $3.2 billion
  • Cash flows from operations of $32.5m
  • Combined residential and commercial loan book of $145.4 billion
  • Final dividend yield of 7.4% based on closing share price of $1.41 at 30 June 2018
  • Return on equity of 33%, up from 31% in FY2017.
  • 30.4% (fully diluted) investment in Think Tank Group Pty Ltd for $10.9 million

Company update

Since listing on the ASX the sector in which the Group operates has been confronted by a number of challenges, including: property price contractions, changes to foreign investor requirements, regulatory intervention, changing lender appetites, significant scrutiny by the regulators and market noise about potential impacts of all of this activity on the sector. “In this environment we have established a track record of financial performance underpinned by earnings growth and ongoing improvement in earnings quality. We are proud of the company’s performance and the results we are announcing today.”

Looking ahead

The past 18 months has seen a significant examination of the lending sector in Australia. “The findings of these inquiries should assist the government to promote a competitive and stable financial industry that contributes to Australia’s productivity,” said Mr Bailey. “We believe, and the Government recognises, that the mortgage broking sector provides vital competition to all Australians and it also an important contributor to the Australian economy in its own right.

“The regulatory reviews of the industry have already led to a level of tightening in credit which we expect will continue in the short term. An effectively functioning financial system requires an appropriate balance of regulation and self-regulation. We will continue to work closely with government, regulators and our industry partners to ensure momentum-based decisions do not drive unintended negative consequences for Australian borrowers.

“With competition and consumers at the core of our business AFG will continue to be a first-choice partner for lenders and broking groups. AFG has 50 lenders on its panel with more than 40% of residential borrowings going to lenders other than the four major banks, and AFG remains committed to ensuring choice and competition remains for all Australian consumers,” said Mr Bailey.

“The broker value proposition is strong, and broker introduced business now represents over 55% of the home lending market. Consumers are clearly comfortable with the channel.

“The industry will continue to evolve and as an agile business in the sector with access to broad distribution and funding and building blocks in place, the future will provide opportunities for AFG and I look forward to another successful year for the company,” he concluded.

Brokerage settlements down 7% in “flat market”

Mortgage Choice saw its net profit after tax (NPAT) rise by an annualised 3.3% to $23.4m in FY2017, according to the firm’s latest financial results, released Tuesday, via Australian Broker.

The firm’s core broking business posted a cash NPAT of $22.75m, up 4% year-on-year. Its loan book at the end of June reached $54.6bn (a 2.3% growth), however, settlements – which reached $11.5bn –  were down 7%.

“[D]espite the strength of our brand and customer offering, settlements in FY2018 declined in a flat market and we are not growing our franchisee numbers,” Mortgage Choice CEO Susan Mitchell said.

“Through a thorough consultation process with franchisees it became very clear we needed a more competitive remuneration structure and needed to adjust the way we deliver our services, so that we can grow our network and market share,” Mitchell added.

In June, an investigation by Fairfax and ABC revealed many franchisees had been left finically worse off due to low commissions and unrealistic targets. Further, 170 – almost half the network – were considering legal action.

The CEO believes Mortgage Choice’s new hybrid broker remuneration model, introduced in July, will provide franchisees with higher pay and reduce their “income volatility”. She said this will enable them to invest in their businesses while attracting new, high quality brokers. Mitchell also revealed that more than 80% of broker franchisees have already adopted the new model.

This 2018, the firm invested $3.4 million in its new broker platform, which will enter pilot phase before its roll-out to franchisees by the next fiscal year.

“Our new broker platform was built by our in-house team of talented technology professionals to meet the specific requirements of the business and will enable our network to operate more efficiently while improving the overall customer experience,” said Mitchell.

Looking ahead, Mortgage Choice maintains a sound outlook for the mortgage broking industry amid a “complex lending environment” arising from an increase in wholesale funding costs, regulatory changes and tightening lending policies, as borrowers seek advice from qualified professionals.

“As we head into FY2019, we are confident the changes we have introduced will see us grow settlement volumes and market share over the medium to long-term. Having a greater share of revenue should enable our network to invest in their businesses while attracting new, high quality franchisees and loan writers to the network. At the same time, we continue to look at ways in which we can improve efficiencies,” said Mitchell.

“More than half of all home loans each year are originated by mortgage brokers, and I am confident borrowers will look to our well-known and trusted national brand for one of the best consumer propositions in the market,” she continued.

NAB 3Q18 Update – Beware The Unknowns

NAB released their Q3 Trading update and capital report today. They said that cash earnings declined by 1%, and compared to the prior corresponding period were down 3% reflecting higher investment spend and credit impairment charges.

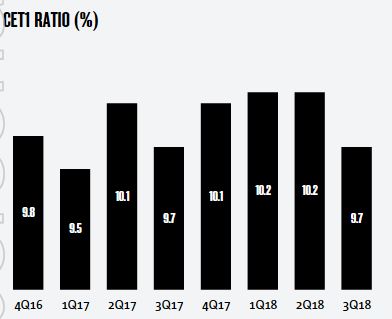
Their unaudited statutory net profit was $1.65 billion, and their CET1 ratio was 9.7%, which was down about 50 basis points from 1H18. The drop from 10.2% at March 2018, largely reflects the impact of the interim 2018 dividend declaration (63bps net of DRP) and seasonally stronger loan growth in the June quarter.

They expect to meet APRA’s ‘unquestionably strong’ target of 10.5% in an orderly manner by January 2020.

Their leverage ratio (APRA basis) was 5.3%, the liquidity Coverage Ratio (LCR) quarterly average was 132% and the Net Stable Funding Ratio (NSFR) was 113%.

While revenue was up 1% due to good growth in SME lending within Business & Private Banking and a strong contribution from New Zealand Banking, net interest margin declined slightly, reflecting elevated short term wholesale funding costs and ongoing intense home loan competition.

In addition, expenses rose 2% due to higher compliance costs, investment spend consistent with the accelerated strategy, and increased depreciation and amortisation.

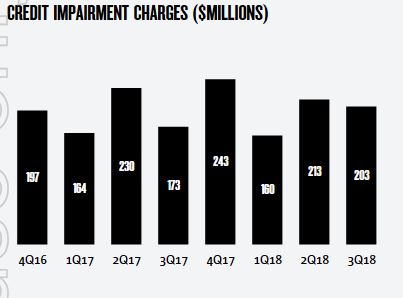
Credit impairment charges rose 9% to $203 million and included $25 million of additional collective provisions for forward looking adjustments (FLAs), bringing the total balance of FLAs to $547 million.

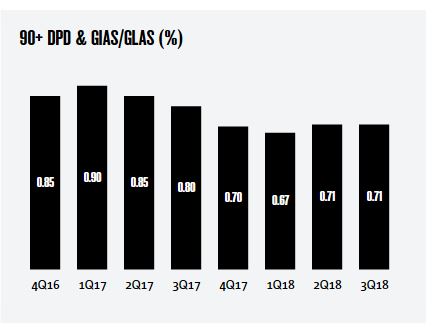
They say asset quality remains sound with the ratio of 90+ days past due and gross impaired assets to gross loans and acceptances steady at 0.71%.

However, 90-Day past due residential mortgage loans stood at $2,015 million, at 30th June 2018, compared with $1,956 million in March 18, so delinquencies are rising. Impaired facilities also rose a little. $20 million of mortgages were written off in the quarter, compared with $10 million in the prior quarter.

They also warned of further provisions for “unresolved compliance issues” in the next quarter. No guidance on the quantum, so far.

They reported that their priority Segments Net Promoter Score (NPS) declined from -9 in March to -14 in June, partly reflecting an overall industry decline, with NAB’s priority segments NPS now second of the major banks.

ANZ Q318 Pillar Update Reveals Credit Tightening

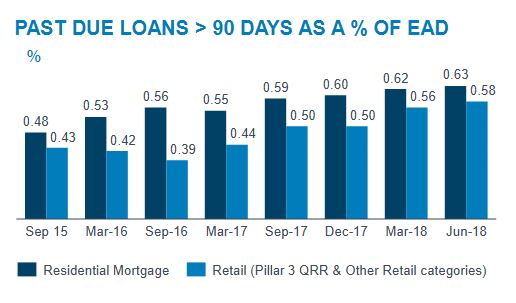
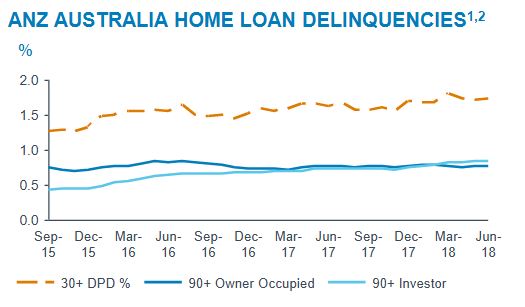
ANZ released their latest update today, and it shows the benefit of returning to its core retail business in Australia, and the release of capital resulting from this. Provisions were significantly lower, thanks to a shirking institutional book, but the home lending sector past 90 days continues to rise to 0.63%, up 10 basis points from March 2016. This is pretty consistent across the industry, despite ultra-low interest rates.

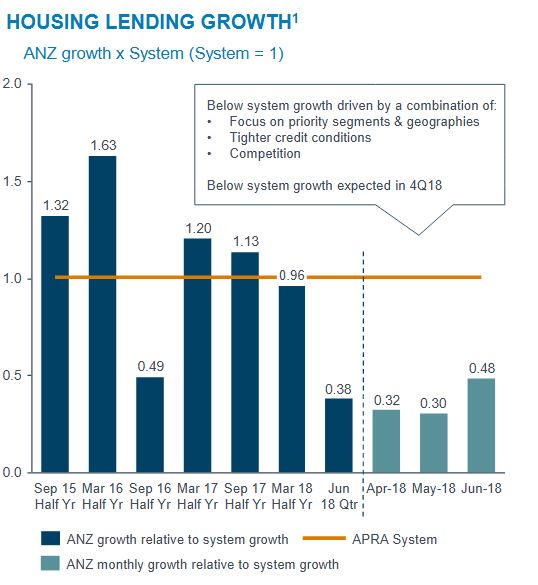
In fact their disclosure on home loans was quite revealing, with lower system growth, a focus on owner occupied loans, and a reduction in mortgage power. This underscore the credit tightening is not temporary.
The Bills/OIS spread has remained elevated suggesting margin pressure is in the wind.

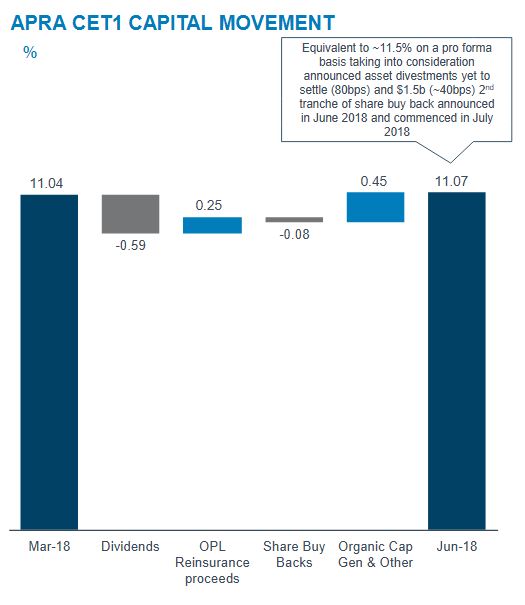
They said level 2 Common Equity Tier 1 (CET1) ratio was 11.07% at Jun-18, up 3bps from Mar-18 largely driven by: organic capital generation (+50bps) and receipt of reinsurance proceeds from the One Path Life (OPL) sale (+25bps); offset by the FY18 Interim Dividend (-59bps) and the share buyback (-8bps). 2018 interim DRP was neutralised.

The ¬$1.5bn of the announced $3bn on-market share buyback had been completed as at 30-Jun 2018.

Total Risk Weighted Assets decreased $2bn to $394bn driven by a $2bn reduction in CRWA. There was a $2bn reduction in CRWAs from net risk improvement across both Institutional and Retail businesses in Australia & New Zealand.

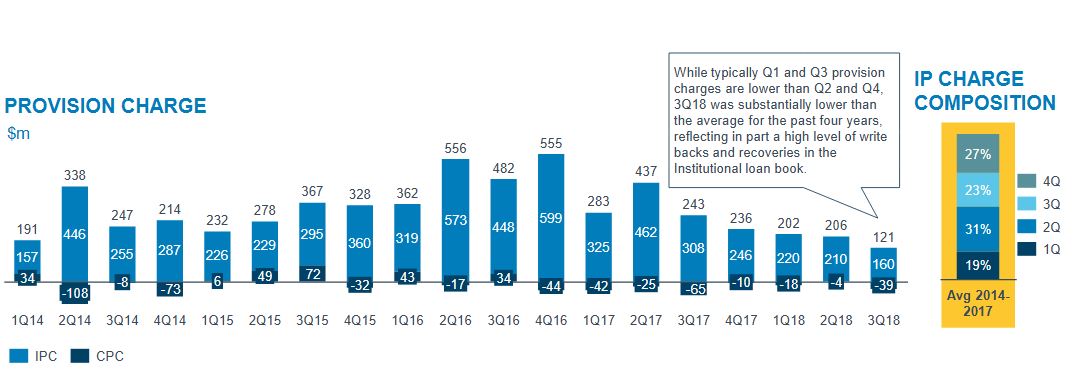
Total provision charge was $121m in 3Q18 with individual provision (IP) charge of $160m. The IP charge in 3Q18 was the lowest quarter since 2014, reflecting both the ongoing benign environment and improved quality of the portfolio

While typically Q1 and Q3 provision charges are lower than Q2 and Q4, 3Q18 was substantially lower than the average for the past four years, reflecting in part a high level of write backs and recoveries in the Institutional loan book.

ANZ has retained an overlay initially taken at 30 Sep 2017 in relation to the Retail Trade book which remains on watch.

Australian Residential Mortgage 90+ day past due loans (as a % of Residential Mortgage EAD) was flat vs prior quarter. There are some pockets of stress in the mortgage book, primarily in Western Australia, more particularly in Perth itself.

Throughout FY18 the Australian housing system has been characterised by slowing credit system growth, increased price competition, increased capital intensity and tighter credit conditions. As at end June 2018, YTD APRA System has grown 4.1%, down 18% vs. prior comparable period 5.3%.

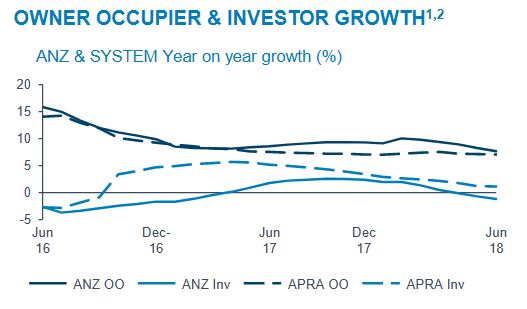
ANZ’s ongoing focus is on the Owner Occupier Principal & Interest segment, with Owner Occupier loan growth of 4.4% annualised in the June quarter. Investor segment growth in the June quarter was -2.5% annualised.

ANZ’s total Australian home lending portfolio grew at 0.4 times system in the June quarter (2% annualised growth).

ANZ Interest Only home loan flows in the June quarter represented 13% of total home loan flows.

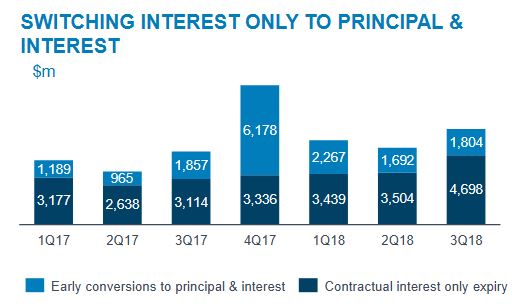
$6.5bn of Interest Only loans switched to Principal & Interest in the June quarter (3Q18), compared with $5.2bn in 2Q18,$5.7bn in 1Q18 and $5.6bn per quarter on average across FY17.

They show the expected rate of interest only loans peaking in the next year or so.

The combined impact of prudential responses over the past 3 financial years including various regulatory changes, together with subsequent policy changes by the banks, has been a meaningful reduction in the average maximum borrowing capacity for home loan borrowers. This suggests to us that there are higher risks in the back book, compared with new business being written now and confirms the reduction in “mortgage power” available to borrowers.

Bendigo And Adelaide Bank FY18 Results

Bendigo and Adelaide Bank released their full year results today.  And given everything, it was not a bad result. But margin pressures and questions about future home lending volumes haunt the sector, and Bendigo is no exception.

Australia’s fifth largest bank announced an after tax profit of $434.5 million for the 12 months to 30th June 2018, up 1.1% from the prior year. Underlying cash earnings were $445.1m up 6.4% on the prior year. They were lower in the second half.

Their cost to income ration fell 50 basis points to 55.6% and their return on equity was 8.23%, up 13 basis points. They called out increase compliance costs, a 3.5% rise in staff salaries, higher software amortisation and “2H18 negative jaws”.

Total gross loans rose 1.4% to $61.8 billion, home lending grew below system at 4.7%, and retail deposits stayed steady at 80.2%, growing at 0.9% in the year.

They reported a margin of 2.36%, up 14 basis points, but the exit margin is falling, reflecting pressure in the market. Deposits were repriced by 11 basis points over the year, especially in the second half.

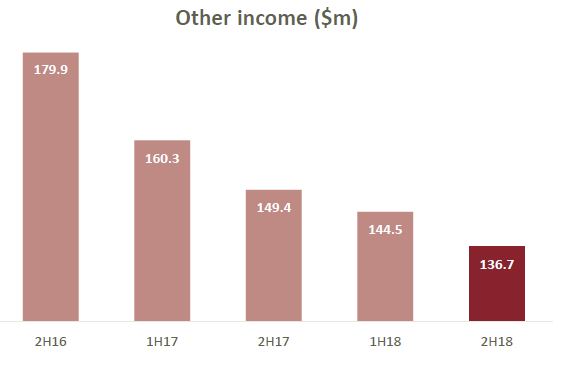
There was a significant fall in “other income” with lower ATM fees, lower trading book income and a range of other factors. It fell 9.2% on the prior year from $309.7 million to $281.2 million this year. This is reflective of industry-wide pressures.

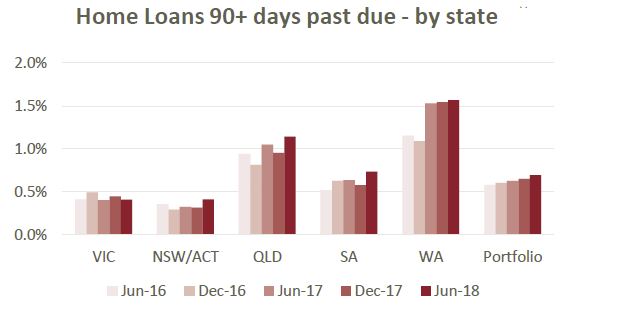
While business arrears fell slightly, there were rises in 90+ past due in WA, QLD and NSW/ACT rising, so the portfolio risks rose.  Keystart loans were included from June 2017.

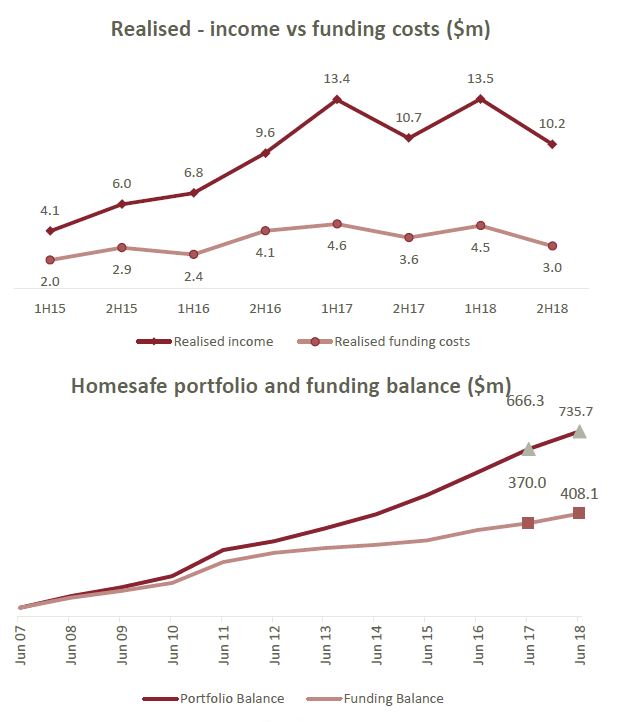
Homesafe’s overlay reflects an assumed 3% increase in property prices in the next 18 months, before returning to a long term growth rate of 6%.

Great Southern past due 90 days was $50.5 m, down 36% from June 2017.

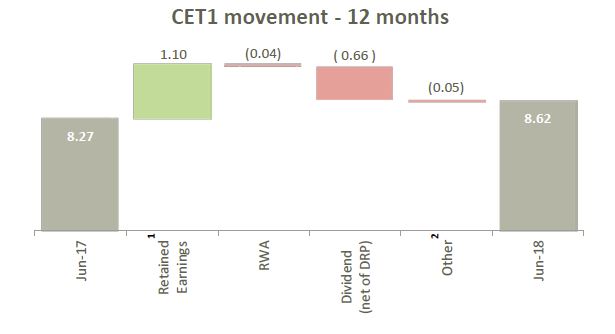
Their CET1 ratio rose 35 basis points since June 2017 to 8.62%. Their total capital rose 39 basis points to 12.85%.

AASB9 lead to an increase of $112.8 expected loss and the increase was taken through retained earnings as at 1 July 2018. CET1 ratio will decreased by 8 basis points on 1 July 2018.

They said their last RMBS transaction was in August 2017 for $750m, they are evaluation the new APRA credit risk proposals, and work toward advanced accreditation is continuing (though we think the benefit is being eroded). Their liquidity coverage ratio is 125.6% and the Net Stable Funding ratio at 109% at 30 June 2018.

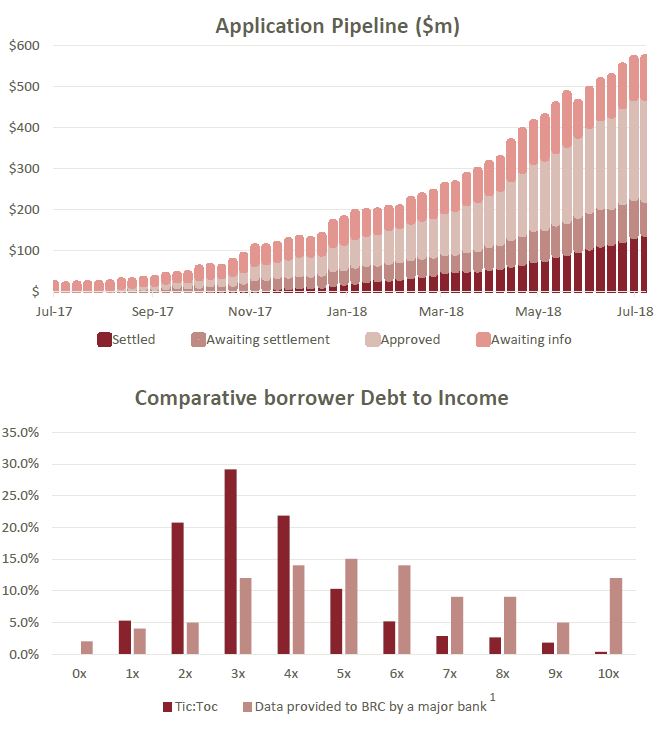
They also disclosed data from Tic:Toc, the quick approval lender, with $1.36bn of submitted applications and $170m loan portfolio.

…suggesting a “more responsible way to lend”.

CBA Results Highlight Pressure Points for Australian Banks

From Fitch Ratings.

Fitch Ratings says the Commonwealth Bank of Australia’s full-year results to 30 June 2018 (FY18) broadly support the agency’s expectation that earnings pressure would emerge for Australian banks during 2018. An increase in wholesale funding costs led to a reduction in CBA’s net interest margin in 2H18, loan growth continued to slow and continued investment into the business and compliance contributed to higher expenses. Mortgage arrears also trended upwards due to some pockets of stress, and while they have not translated into higher provision charges as yet due to strong security values, continued moderation in Australian house prices may result in higher provisioning charges in future financial periods.

Most of the earnings issues appear applicable across the sector and are likely to remain into 2019, placing pressure on profit growth for all Australian banks. Increased regulatory and public scrutiny of the sector may make it difficult for the larger banks to reprice loans to incorporate the increase in wholesale funding costs, meaning net interest margins are likely to face some downward pressure. Loan growth is likely to further slow as the housing market continues to moderate, while compliance costs continue to rise due to the scrutiny on the sector.

The most prominent scrutiny is the royal commission into misconduct in the banking, superannuation and financial services industry, which has already identified a number of shortcomings within the industry. We expect the release of the interim royal commission report, due to be published by the end of September 2018, to give a better view of how widespread these shortcomings are and what impact they may have on the credit profile of Australian banks.

CBA’s FY18 results show a level of resiliency despite these issues. The bank reported cash net profit after tax from continuing operations declined 5% to AUD9.2 billion in FY18, but this was driven by a number of one-off charges, including a AUD700 million fine to settle a civil case in relation to breaches of anti-money laundering and counter-terrorism financing requirements. Cash net profit after tax from continuing operations rose by 4% to AUD10.0 billion when the one-off items were excluded.
Balance-sheet metrics remain consistent with Fitch’s expectations. The bank reported a stable common equity Tier 1 ratio of 10.1%, which incorporates the AUD1 billion additional operational risk charge (essentially an increase of AUD12.5 billion in operational risk-weighted assets) put in place following the publication of the independent prudential inquiry report in May 2018. The divestiture of a number of assets planned for FY19 as well as CBA’s ability to generate capital through retained earnings mean the bank is well-positioned to meet the regulator’s “unquestionably strong” capital requirements ahead of schedule. CBA’s liquidity coverage ratio (131%) and net stable funding ratio (112%) both increased due to an improvement in the bank’s deposit mix towards more stable deposit types and a lengthening in the average term to maturity of its wholesale funding.

Fitch continues to monitor CBA’s progress in remediating shortcomings in its operational risk controls and governance identified in the May 2018 independent prudential inquiry report as risks around this process were a key driver of Fitch’s revision of CBA’s Outlook to Negative. CBA noted in the FY18 results announcement that the remediation program has received approval from the Australian Prudential Regulation Authority and that it aims to make significant progress in implementing the program over FY19. However, CBA also noted that full remediation would be a multiyear process for the bank.

Suncorp Full Year Profit Falls

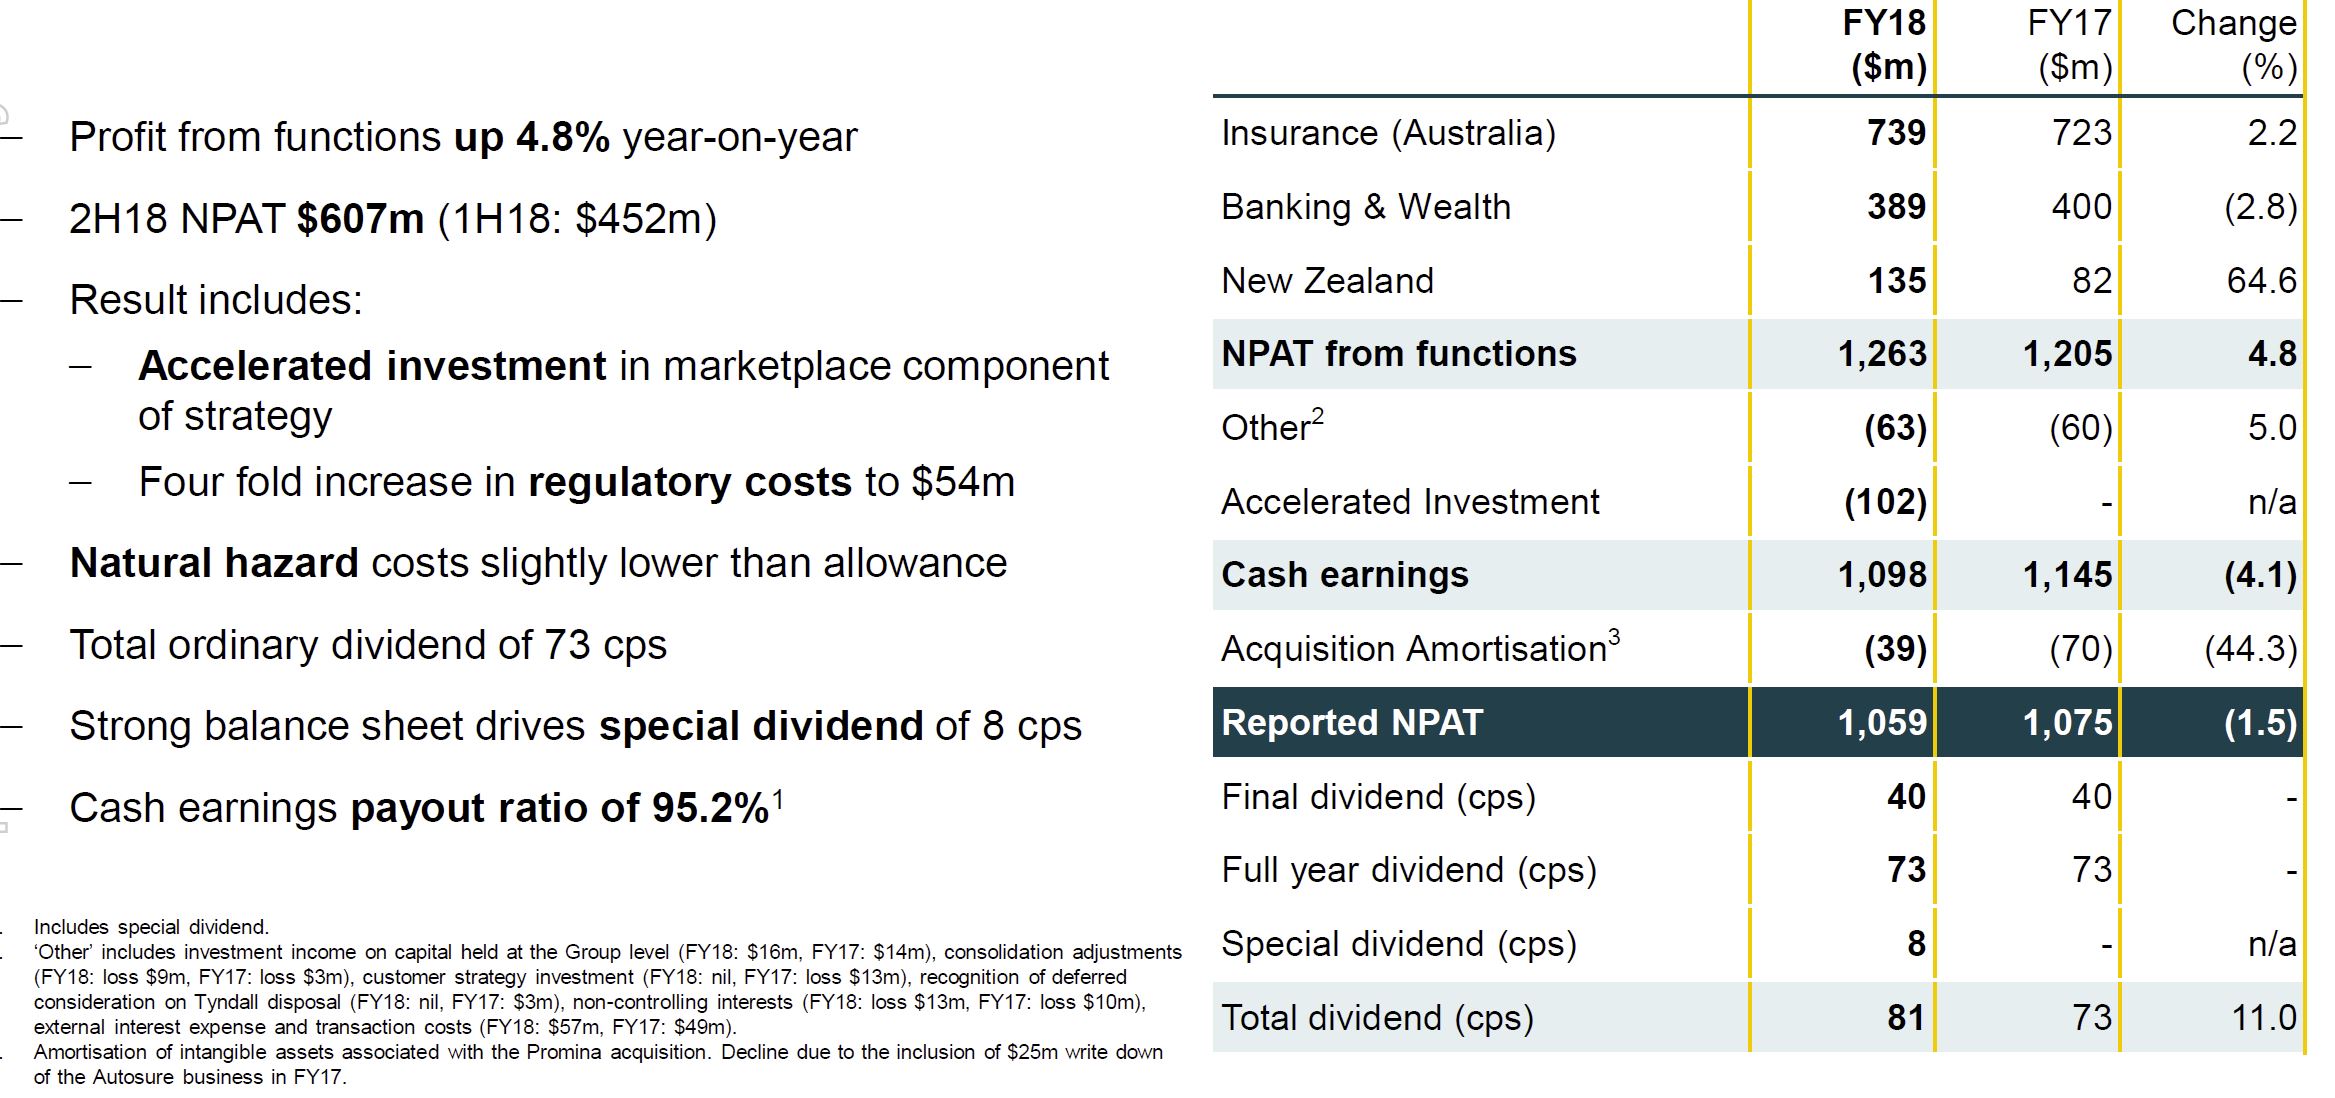
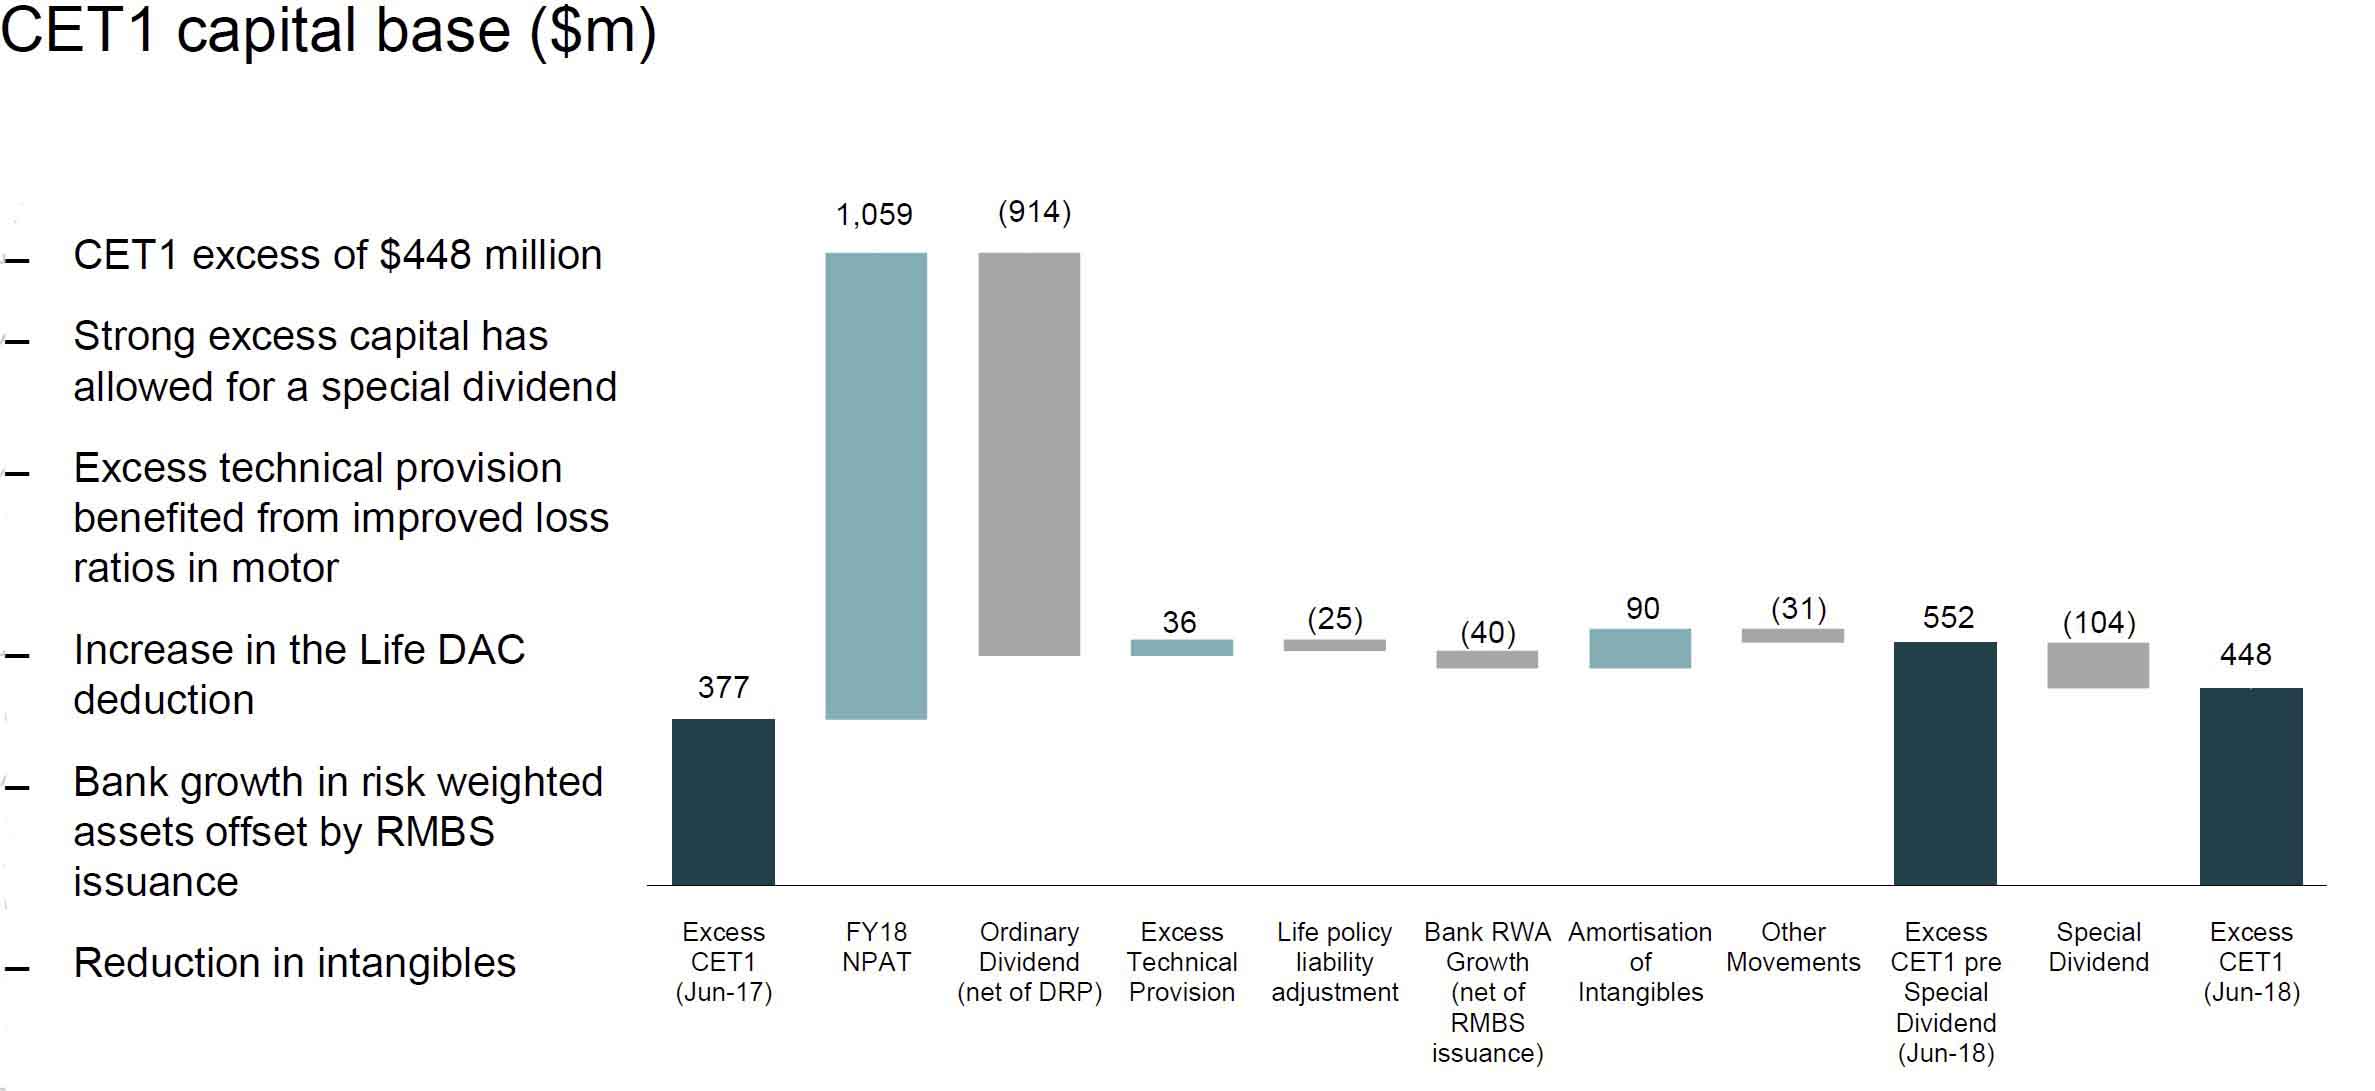
Suncorp has announced a net profit after tax (NPAT) of $1,059 million, a 34 per cent uplift on the first half of 2018.

However, this is 1.5% lower than the FY17 result, which they say was driven by the accelerated investment in the strategy. Actually, given the complexity of the market, and their business, I think they are doing rather well!

The Board has declared a final ordinary dividend of 40 cents per share and a special dividend of 8 cents per share. This brings the total dividend for 2017-18 to 81 cents per share, fully franked. Total dividend to investors in FY18 is up 11 per cent on the prior year.

Suncorp said the result was driven by stronger second half performance, reflecting the early benefits of the strategy.  The Business Improvement Program exceeded target by $30m. Digitisation of the business continues apace.

Key numbers

Insurance (Australia) delivered NPAT of $739 million. Motor and Home portfolios have performed strongly with GWP growth of 4.7 per cent, and claims performance at better than industry levels.

Banking & Wealth delivered NPAT of $389 million, with above system growth in lending (1.2x system or 6.2%)  and deposits (up 4.7%). A strong profit increase in Wealth was driven by improved investment income and reduced project costs.
New Zealand achieved NPAT of A$135 million, reflecting premium growth, unit growth, good claims management and expense control.

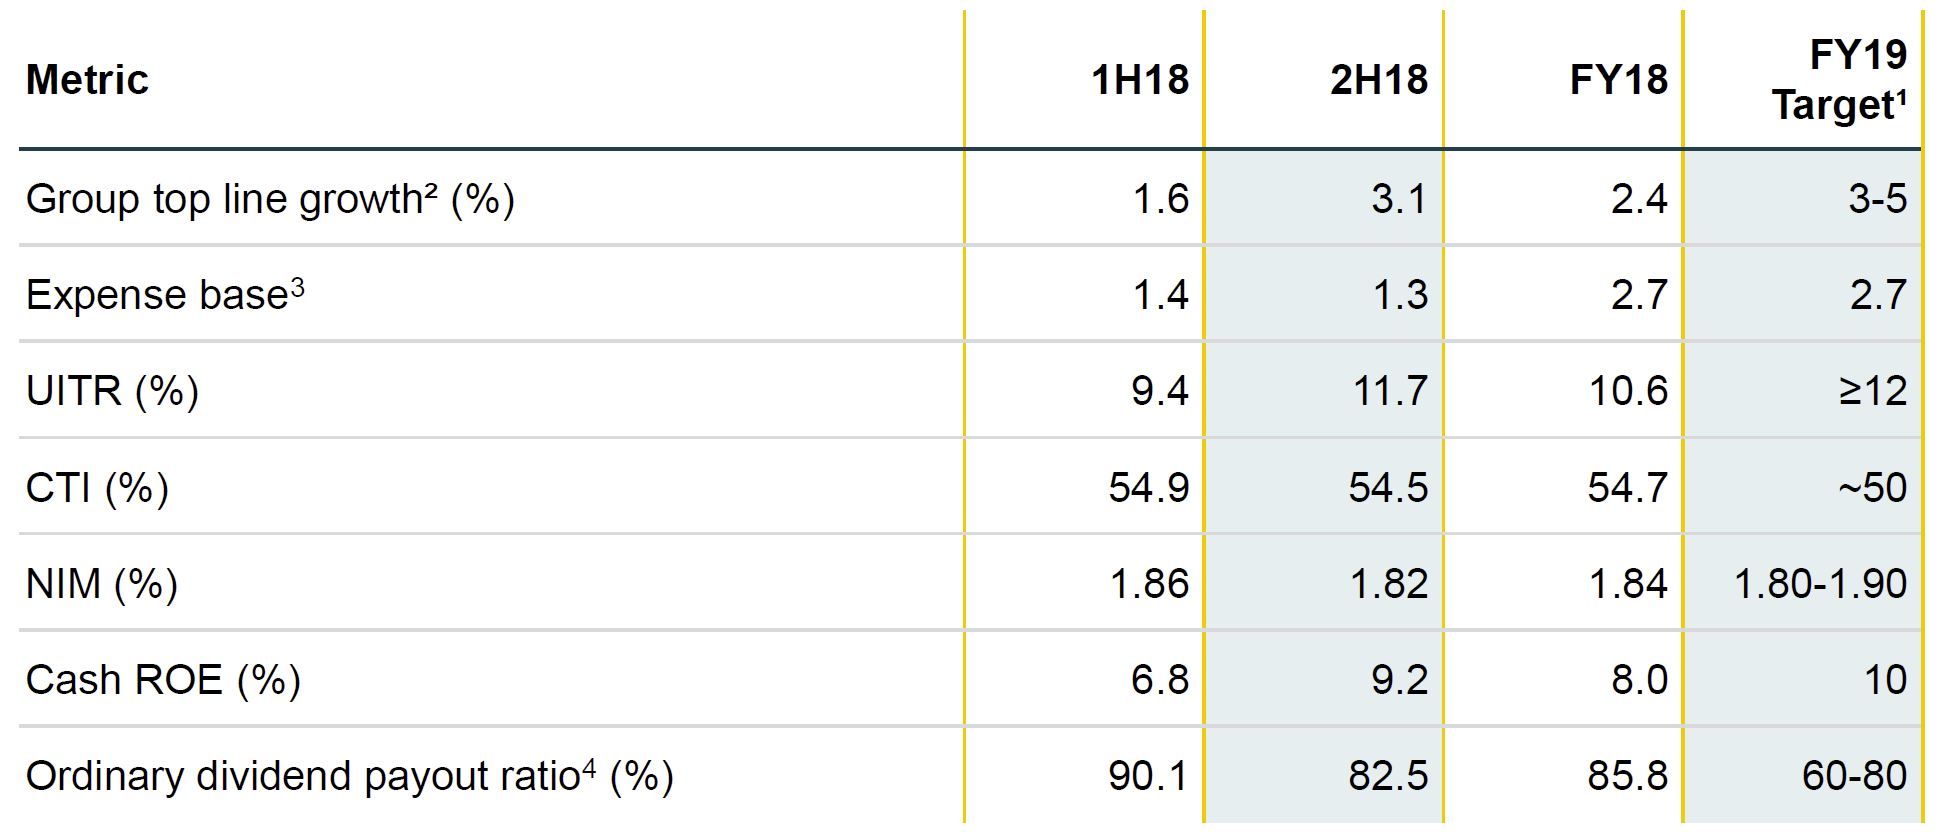
The Group NIM was 1.84 in FY18, but fell in the second half, from 1.86 to 1.82, reflecting the funding costs mix.  They suggest BBSW rates will “moderate”.

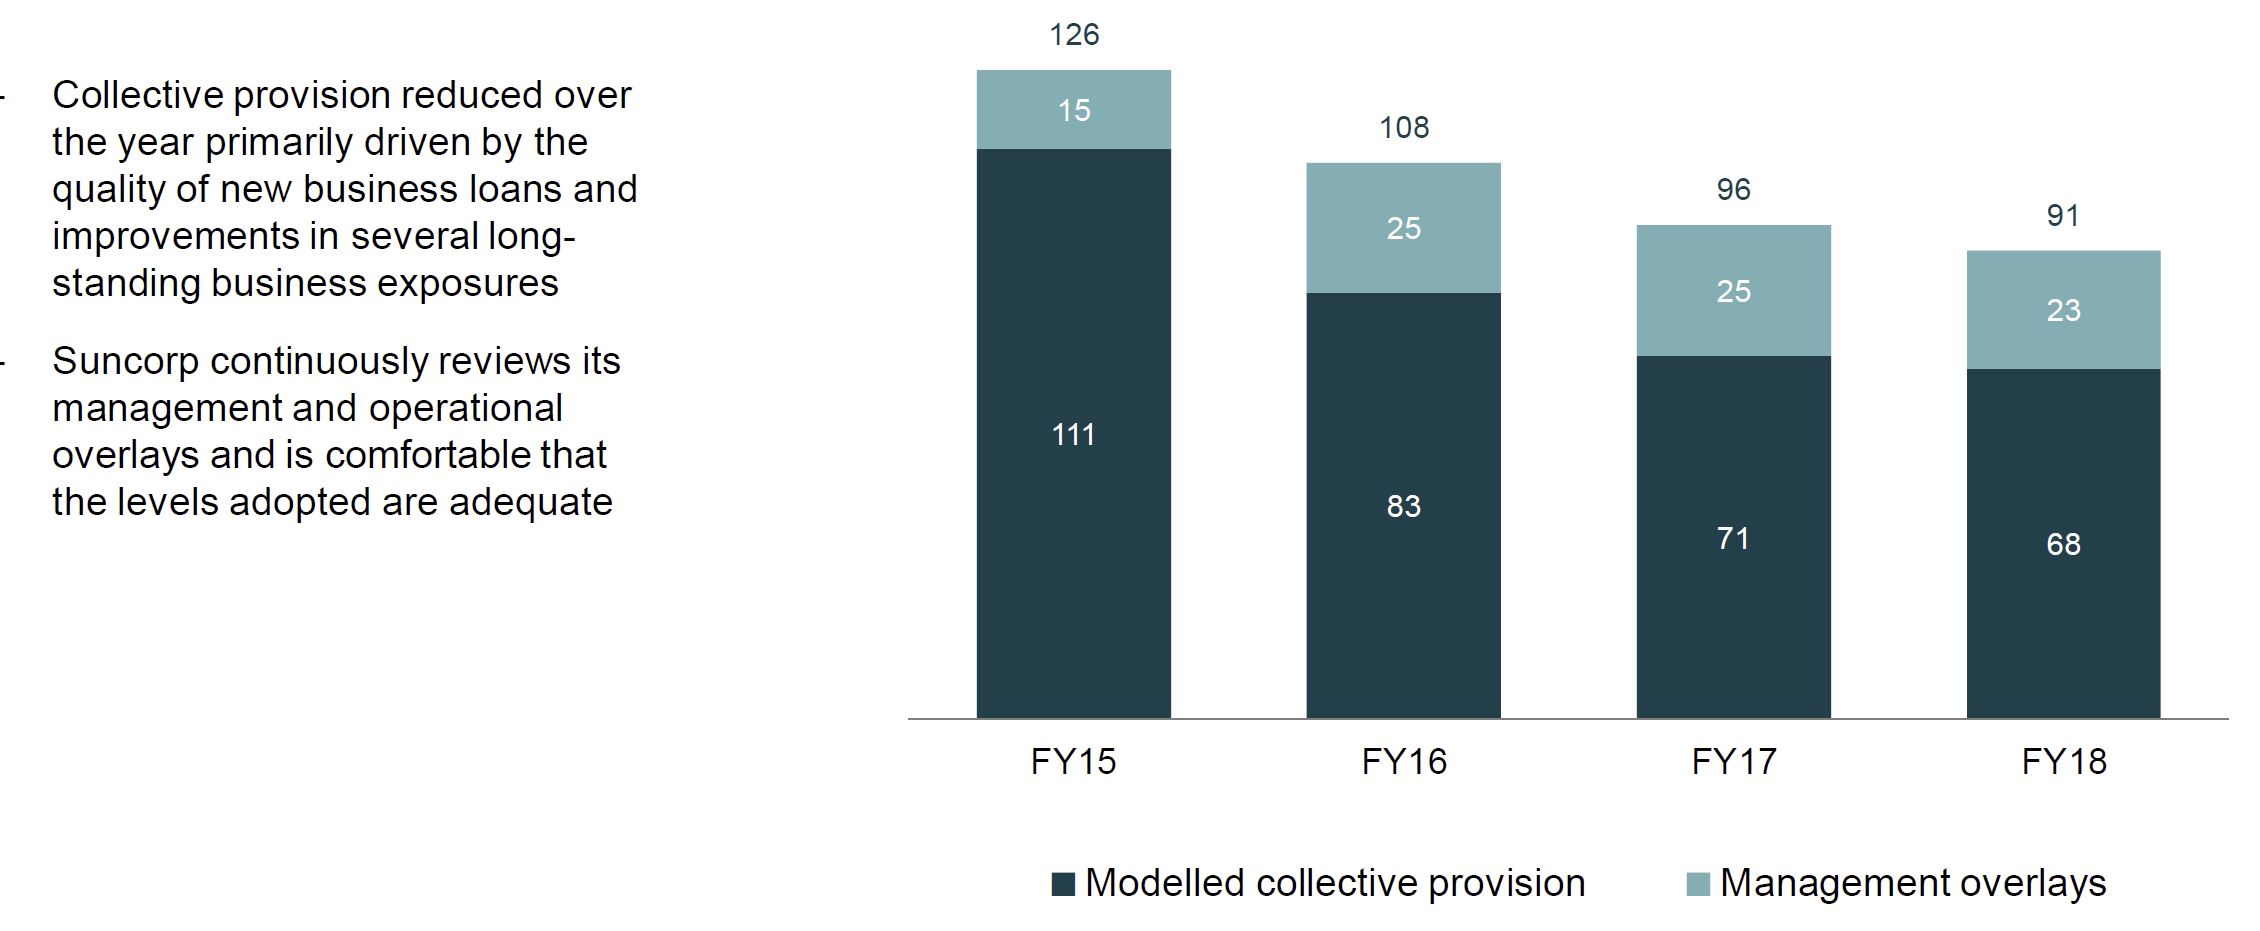
Overall provisions fell.

But past due on the home loans portfolio rose, consistent with other lenders.

Sale of Australian Life insurance business

Following the completion of a strategic review, Suncorp has entered into a non-binding Heads of Agreement with TAL Dai-ichi Life Australia to sell the Australian Life insurance business.

As part of the proposed transaction, Suncorp will enter into a 20-year strategic alliance agreement with TAL to provide life insurance products through Suncorp’s direct channels, including its digital channels, contact centres and store network. Completion of the transaction is expected to occur by the end of 2018, subject to regulatory approvals and conditions.

Capital

What Suncorp said

Suncorp CEO & Managing Director Michael Cameron said that the strong performance in the second half is driving momentum for FY19.

“Six months ago, we committed to a stronger second half, as the benefits of our strategy begin to flow through, and I’m pleased to report a 34 per cent uplift on NPAT on the first half. This result is a direct outcome of the repositioning programs we have implemented over the past two years. We are now beginning to see momentum, to deliver a further uplift in shareholder returns in FY19,” he said.

CBA is Less Focused On Brokers

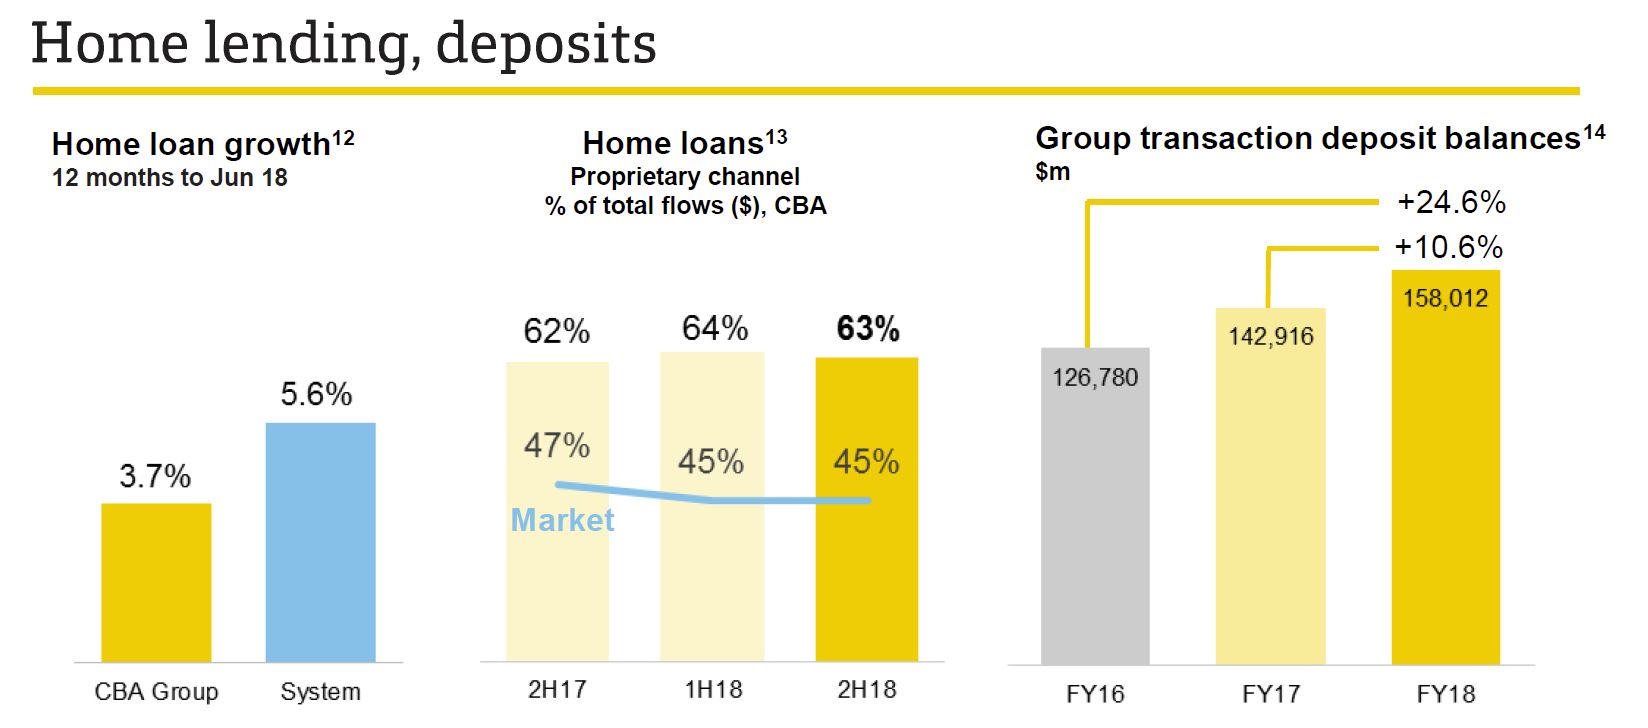
In the CBA’s full-year 2018 (FY19) financial results, released yesterday, the share of new home loans originated by brokers dropped from 43 per cent  in FY17 to 41 per cent in FY18, as they focus on “their core market”.

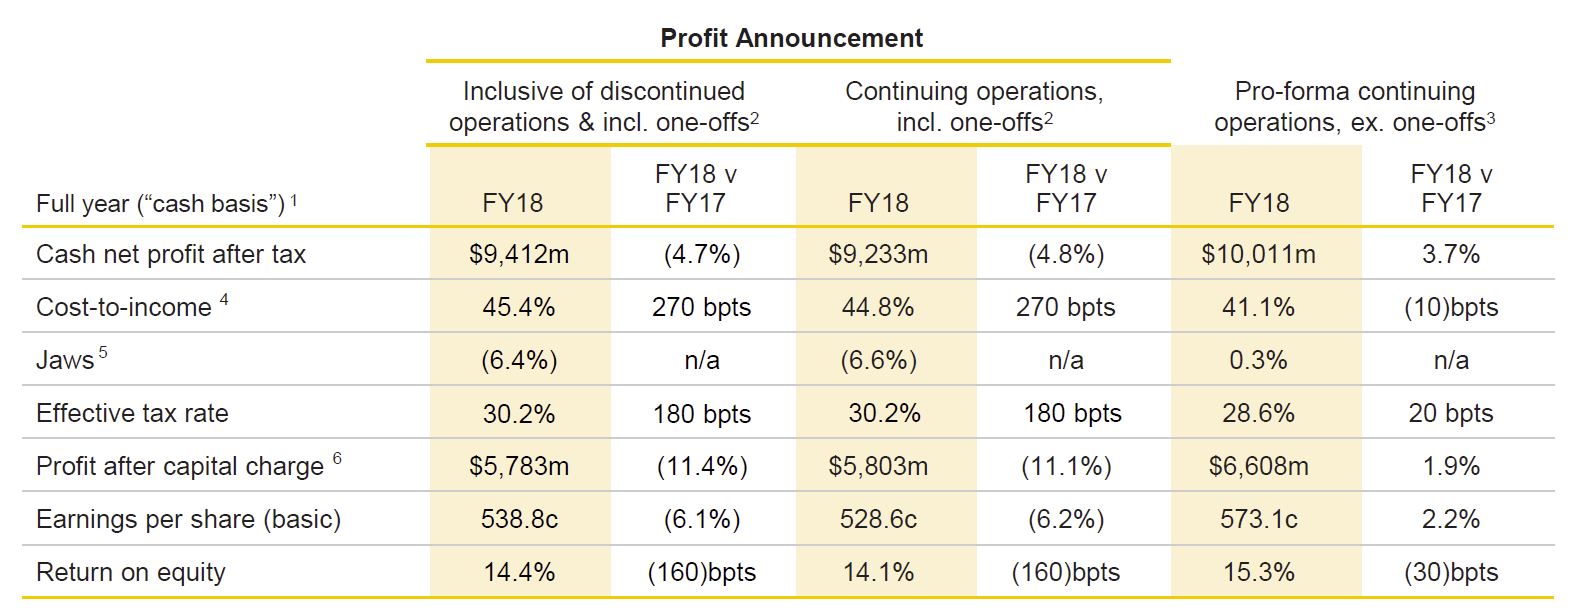
CBA’s net profit after tax (NPAT) also took a hit over FY18, falling by 4.8 per cent to $9.23 billion, the first profit decline in 9 years. NIM was lower in the second half.

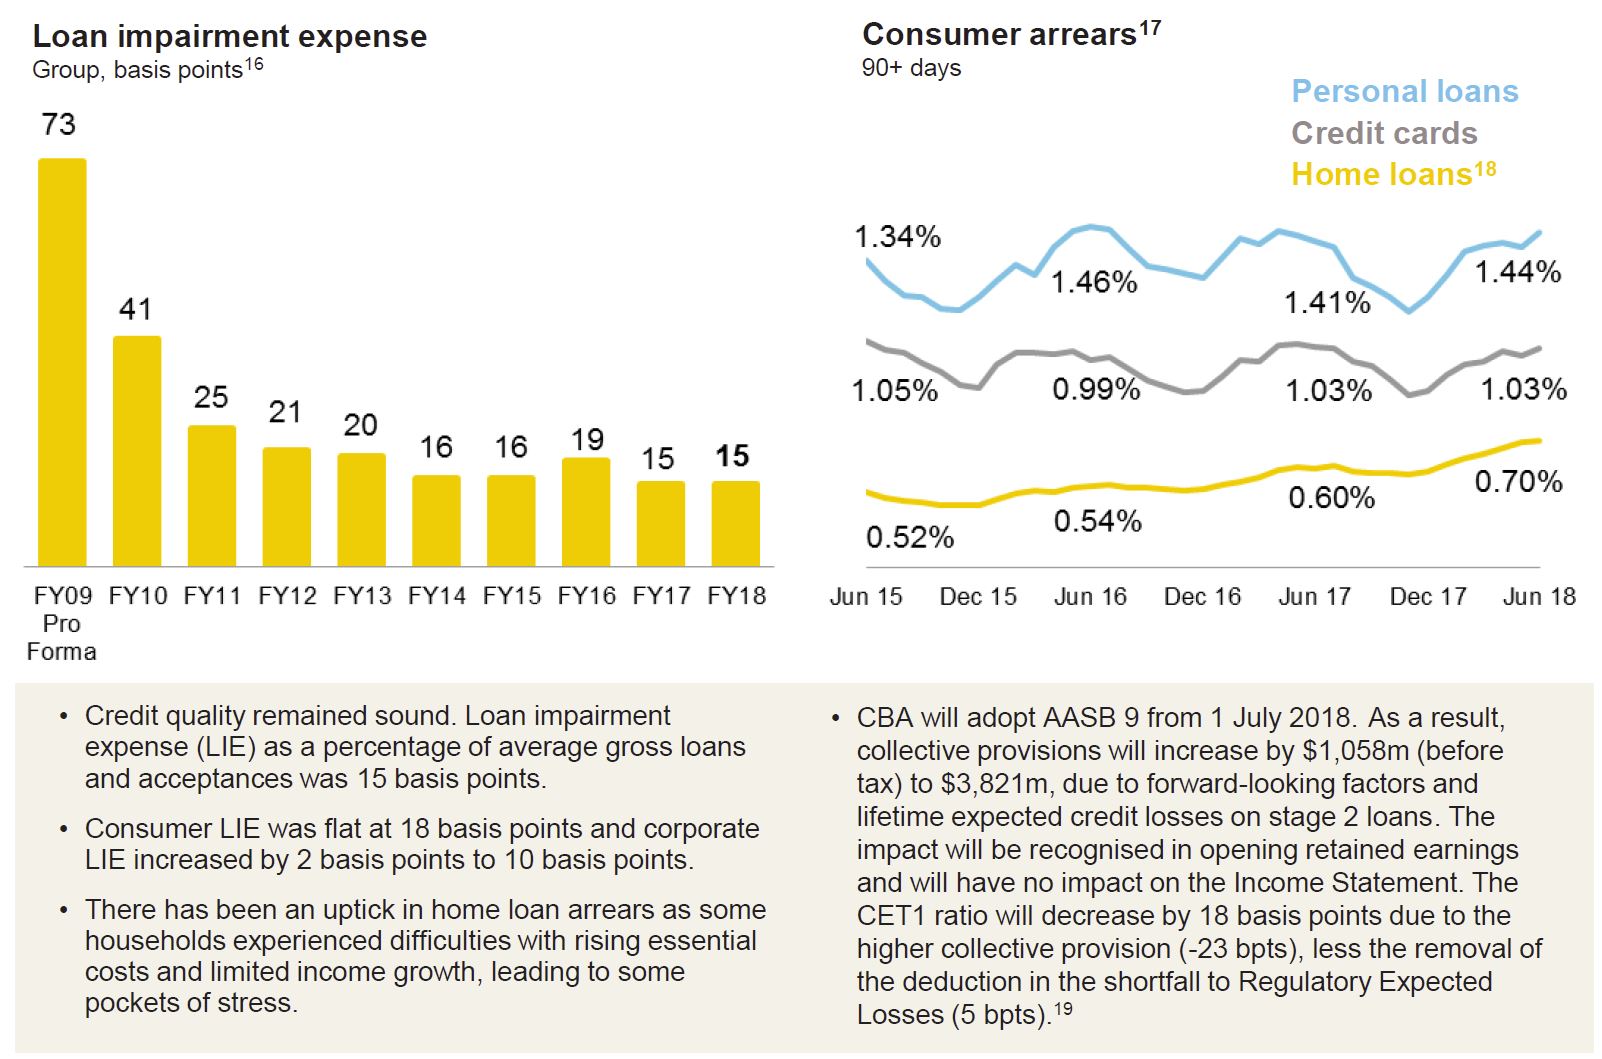
They warned of higher home loan defaults “as some households experienced difficulties with rising essential costs and limited income, leading to some pockets of stress”.

CEO Matt Comyn attributed the decline in profit growth to “one-off” payments, which included CBA’s $700 million AUSTRAC penalty, the $20 million settlement paid to ASIC for alleged bank bill swap rate (BBSW) rigging, and $155 million in regulatory costs incurred from the Royal Commission into Misconduct in the Banking, Superannuation and Financial Services Industry.

“There has been a number of one-off items that have impacted the result, including a couple of large penalties that we have resolved. If you strip some of those out, actually the result looks more from an underlying perspective up 3.7 per cent,” Mr Comyn said.

We discussed the results in our latest video.

More from Australian Broker.

The number of broker-originated loans as a proportion of all new business settled by the major bank has dropped alongside a fall in residential lending.

Over the same period, the total number of home loans settled by CBA also dropped from $49 billion in FY17 to $45 billion in FY18.

The bank’s overall mortgage portfolio now totals $451 billion, with the share of broker-originated loans slipping from 46 per cent in FY17 to 45 per cent in FY18.

In its presentation notes, CBA made specific reference to the bank’s focus on its “core market” of owner-occupied lending through its propriety channel, with the number of loans settled through its direct channel rising from 57 per cent to 59 per cent in FY18, and the share of new owner-occupied mortgages also growing from 67 per cent to 70 per cent.

The share of investor loans settled by CBA over FY18 declined from 33 per cent to 29 per cent, now making up 32 per cent of the major bank’s mortgage portfolio.

Interest-only lending fell sharply over FY18, falling by 18 per cent from 41 per cent of new loans settled in FY17 to 23 per cent in FY18.

The proportion of new loans settled with variable rates increased in FY18, from 85 per cent to 86 per cent (81 per cent of CBA’s portfolio).

CBA CEO Matt Comyn attributed the fall in the bank’s home lending to risk and pricing adjustments introduced by the lender over the financial year.

“[We] have been prepared to make some choices from both a risk and pricing perspective, which has seen us grow below system in home lending,” the CEO said.

“We will continue to make the right choices from volume and margin as we think about our home lending business. But overall, the core franchise of the retail bank has continued to perform well.”

Mr Comyn also claimed that despite slowing credit and housing conditions, he expects the bank to generate 4 per cent credit growth in FY19 and noted that CBA would not be looking to make any further changes to its lending policy.

“Consistent with the remarks from the chair of APRA, we see that the majority of the tightening work has been done, certainly at the margin, and there’s certainly some potential in the application of those policy changes,” the CEO continued.

“[We] certainly don’t see any big policy adjustments on the horizon. We feel like that 4 per cent credit growth, given what we’re seeing at the moment in the system, is about right, and of course, it’ll be a function of our performance against that system.”


AMP Gives An Update

AMP today outlined a series of actions being taken to reset the business, prioritise customers and strengthen risk management systems and controls.

These actions include:

Accelerating advice remediation

ASIC reports 499 and 515 require an industry-wide review of the delivery of ongoing service arrangements and the appropriateness of advice recommendations going back 10 years to 1 July 2008 and 1 January 2009 respectively.

ASIC has also publicly outlined its expectations of the industry with regard to the review and remediation approach to be applied through this ‘look back’ period.

As flagged at the 1Q 18 update and at the AGM in May, AMP has been undertaking a detailed review of advice delivered and fees charged across its entire advice network including its aligned adviser base. The company is moving to accelerate its remediation program to ensure all impacted customers are appropriately compensated.

1H 18 net profit attributable to shareholders is expected to include a provision of A$290 million (post-tax) for potential advice remediation. A significant portion of the provision relates to compensation for potential lost earnings. As one of the first instances of applying the ‘look back’ to an aligned adviser network, discussions with ASIC remain ongoing in relation to the detailed scope and methodology.

The program is estimated to cost approximately A$50 million (post-tax) per annum over the next three years and this cost will be expensed as incurred.

AMP has a number of potential recovery options to partially offset these remediation costs in the medium term. These options will be actively pursued. Updates on the delivery and cost of the program will be provided in future financial reporting periods.

Delivering better value for super customers through fee reductions

As part of its continuing commitment to customers and reflecting plans for the simplification of its superannuation product offering, AMP has today announced fee reductions to its flagship MySuper products. These reductions will improve member outcomes, reducing fees for around 700,000 existing customers, and enhance the competitiveness of AMP’s MySuper product suite.

Pricing reductions will be implemented in 3Q 18. AMP continues to work towards rationalising the number of products offered, reducing operational complexity and enabling greater product scale to compete more effectively.

The customer-focused fee reductions announced today will have no impact on the 1H 18 result but are expected to lower Australian wealth management investment related revenue (IRR) by an annualised A$50 million from FY 19. 2H 18 Australian wealth management IRR is expected to be reduced by A$12 million.

Excluding these pricing reductions, and subject to any further management initiatives, guidance for underlying margin compression is expected to average 3-4% over the long term but may be volatile from period to period.

Strengthening risk management and controls

AMP will also invest in significant enhancements to the company’s risk management controls and compliance systems. This is expected to result in approximately A$35 million (post-tax) per annum of one-off costs over the next two years. These costs will be reported below underlying profit.

Reprioritising the portfolio review

Following stabilisation of the business, the portfolio review of the manage for value businesses has been reprioritised. AMP is committed to releasing further value from these business lines and remains in active discussions with a number of interested parties.

1H 18 results expectations

AMP expects to deliver a 1H 18 underlying profit in the range of A$490–500 million. The results demonstrate growth across AMP’s core growth businesses, Australian wealth management, AMP Capital and AMP Bank, offset by a recent deterioration in experience and one-off capitalised losses in Australian wealth protection.

Australian wealth protection 1H 18 profit margins were higher than anticipated, but offset by negative experience and capitalised losses. This will result in negligible operating earnings during the period. The largest impact was a A$20 million one-off negative experience loss associated with reserve strengthening on a large Group plan, terminated on 1 July 2018. The loss of this plan was disclosed at AMP’s FY 17 results.

AMP also expects changes to best estimate assumptions at the half year mainly, for Total & Permanent Disability. These changes are not expected to have a material impact on previous profit margin guidance for Australian wealth protection.

Reported profit attributable to shareholders is expected to be impacted by the A$290 million (posttax) provision for advice remediation and an additional A$55 million (post-tax) of other one-off costs incurred in 1H 18, relating to the Royal Commission, portfolio review and costs of accelerating the advice remediation program in the first half. These items will be booked below underlying profit.

Capital and dividend expectations

AMP remains well capitalised and expects to report Level 3 eligible capital surplus above MRR in the order of A$1.8 billion at 30 June 2018. This includes impacts from the anticipated advice remediation provision, changes to best estimate assumptions in Australian wealth protection and other one-off costs.

AMP is targeting a total FY 18 dividend payout at the lower end of its 70-90% guidance range. To retain capital and strategic flexibility over the coming period, it is expected that the interim dividend may be outside this range. Additionally, the 1H 18 dividend reinvestment plan is not expected to be neutralised.