Top 10 Mortgage Stress Countdown At December 2017

Following our monthly mortgage stress post, released yesterday, we have updated our video which counts down the most stressed households across the country.

As normal, there are some changes from last month, as conditions vary across the states. But overall, we see relatively more stress in Victoria and New South Wales.  We will count down to the post code with the highest levels of mortgage stress.

We also discuss the causes of mortgage stress and what households might do to mitigate the issues.


Mortgage Stress to Trigger Rise in Defaults, says Analyst

From The Adviser.

Defaults are expected to rise this year amid new data which reveals that almost a million Australians are under mortgage stress.

Digital Finance Analytics (DFA) has released its mortgage stress and default analysis for the month of December, revealing that over 921,000 households (29.7 per cent) are under “mortgage stress”, with 24,000 households under “severe mortgage stress”, up by 3,000 from the previous month.

DFA principal Martin North has predicted that more Australians will default on their debts in 2018, with an estimated 54,000 households at risk of 30-day debt defaults in the next 12 months.

“My own view is that we’re going to see default debts rise in 2018,” Mr North told The Adviser. “I can’t see any argument to suggest that it’s going to be different unless income starts to move up in real terms.

“I know that Treasury is forecasting a very positive outlook for wage growth over the next couple of years, [but] I can’t see where that’s coming from at the moment. My own view is that we’re going to see mortgage stress rising and that will actually have a knock-on effect on defaults. So, I’m forecasting defaults will be higher later into the year than they were at the end of last year.”

The data analyst attributed rises in mortgage stress to the “loose” lending standards of previous years.

“Over the last four or five years, lending standards have been a bit too loose,” Mr North said.

“We’ve got a lot of people now who, if they applied for the same mortgage two or three years ago, they wouldn’t now get that mortgage because effectively the affordability criteria has been tightened, the income standards have been tightened, all of the dimensions have been tightened.”

Mr North also urged Australians to keep a budget, and he warned that household accumulation of unsecured debt could further perpetuate mortgage stress.

“There’s an alignment between mortgage stress and rises in other forms of debt,” the principal said.

“What we’re finding is that there’s an accumulation of other debt categories around people with mortgage stress, so it’s part of the problem.”

Despite acknowledging the negative impact that a future rate rise imposed by the Reserve Bank of Australia (RBA) would have on mortgage stress, Mr North believes that the central bank needs to increase its cash rate to ease “systematically structural risk” caused by a high debt ratio.

“The RBA [has] a really tricky situation because we’ve got mortgage lending growing at three times income growth — 6 per cent annual mortgage growth lending and 2 per cent income growth — so, that’s an unsustainable position.

“If they do lift rates, essentially that’s going to put more households under pressure.

“[But] my own view is that the next rate will be up, [and] it won’t be for some months — probably in the second half of 2018 — and I think it’s predicated on what happens to wages.”

Concluding, Mr North said: “I can’t see any logic for driving rates lower, and the challenge is that they should be putting rates higher than they probably will because of the problem with debt overhanging in the system we’ve got at the moment.”

Households Under The Mortgage Stress Gun In December

Digital Finance Analytics has released the December mortgage stress and default analysis update. Across Australia, more than 921,000 households are estimated to be now in mortgage stress (last month 913,000). This equates to 29.7% of households. In addition, more than 24,000 of these in severe stress, up 3,000 from last month. We estimate that more than 52,000 households risk 30-day default in the next 12 months, similar to last month. We expect bank portfolio losses to be around 2.8 basis points, though with losses in WA rising to 4.9 basis points. Households in NSW are showing the most significant rise in stress, thanks to larger mortgages relative to income, while income growth is slow.

Martin North, Principal of Digital Finance Analytics said “the number of households impacted are economically significant, especially as household debt continues to climb to new record levels. Mortgage lending is still growing at three times income. This is not sustainable”. The latest household debt to income ratio is now at a record 199.7.[1]

Risks in the system continue to rise, and while recent strengthening of lending standards will help protect new borrowers, there are many households currently holding loans which would not now be approved. This is a significant sleeping problem and the risks in the system are higher than many recognise.

Our analysis uses the DFA core market model which combines information from our 52,000 household surveys, public data from the RBA, ABS and APRA; and private data from lenders and aggregators. The data is current to end December 2017. We analyse household cash flow based on real incomes, outgoings and mortgage repayments, rather than using an arbitrary 30% of income.

Households are defined as “stressed” when net income (or cash flow) does not cover ongoing costs. Households in mild stress have little leeway in their cash flows, whereas those in severe stress are unable to meet repayments from current income. In both cases, households manage this deficit by cutting back on spending, putting more on credit cards and seeking to refinance, restructure or sell their home.  Those in severe stress are more likely to be seeking hardship assistance and are often forced to sell.

The forces which are lifting mortgage stress levels remain largely the same. In cash flow terms, we see households having to cope with rising living costs whilst real incomes continue to fall and underemployment remains high. Households have larger mortgages, thanks to the strong rise in home prices, especially in the main eastern state centres, but now there are signs prices are slipping. While mortgage rates remain quite low for owner occupied borrowers, those with interest only loans or investment loans have seen significant rises.  We expect some upward pressure on real mortgage rates in the next year as international funding pressures mount, a potential for local rate rises and margin pressure on the banks.

Probability of default extends our mortgage stress analysis by overlaying economic indicators such as employment, future wage growth and cpi changes.  Our Core Market Model also examines the potential of portfolio risk of loss in basis point and value terms. Losses are likely to be higher among more affluent households.

Stress by The Numbers.

Regional analysis shows that NSW has 258,572 households in stress (251,576 last month), VIC 254,485 (253,248 last month), QLD 156,097 (157,019 last month) and WA 121,934 (123,849 last month). The probability of default rose, with around 9,800 in WA, around 9,500 in QLD, 13,000 in VIC and 14,000 in NSW.

The largest financial losses relating to bank write-offs reside in NSW ($1.3 billion) from Owner Occupied borrowers) and VIC ($957 million) from Owner Occupied Borrowers, which equates to 2.1 and 2.7 basis points respectively. Losses are likely to be highest in WA at 4.9 basis points, which equates to $682 million from Owner Occupied borrowers.

You can request our media release. Note this will NOT automatically send you our research updates, for that register here.

[contact-form to=’mnorth@digitalfinanceanalytics.com’ subject=’Request The December 2017 Stress Release’][contact-field label=’Name’ type=’name’ required=’1’/][contact-field label=’Email’ type=’email’ required=’1’/][contact-field label=’Email Me The December 2017 Media Release’ type=’radio’ required=’1′ options=’Yes Please’/][contact-field label=”Comment If You Like” type=”textarea”/][/contact-form]

Note that the detailed results from our surveys and analysis are made available to our paying clients.

[1] RBA E2 Household Finances – Selected Ratios September 2017

Our Most Popular Posts of 2017

As we tie the ribbons on 2017, here are the top 10 most popular posts from the DFA Blog throughout the past year.

Mortgage stress and the property market were to most visited, but Fintech innovation and household finances also featured.  The ABC Four Corners programme generated the most traffic to our site in a single day. Our earlier research on consumer debt continued to rate very highly.

The Definitive Guide To Our Latest Mortgage Stress Research

October Mortgage Stress Higher Again – See The Top 10 Post Codes

Tic:Toc launches with 22-minute home loan

Mounting concerns over Australian housing bubble

Safe as Houses? Not if You Live in Australia

ABC Four Corners Does Mortgage Stress

6 astonishing features of Australia’s current house price boom

Where Do Consumers Fit in the Fintech Stack?

Digital Finance Analytics – Quenching The Thirst For Accurate Household Mortgage Data

The Stressed Household Finance Report 2015 is Available

The Shape of 2018 – The Property Imperative Weekly 30th Dec 2017

In the final edition of the Property Imperative Weekly for 2017, we look ahead to 2018 and discuss the future trajectory of the property market, the shape of the mortgage industry, the evolution of banking and the likely state of household finances.

Watch the video, or read the transcript.

We start with the state of household finances. The latest data from the RBA shows that the ratio of debt to income deteriorated again (no surprise given the 6%+ growth in mortgage debt, and the ~2% income growth). The ratio of total debt to income is now an astronomical 199.7, and housing debt 137.5. Both are at all-time records, and underscores the deep problem we have with high debt.

We think that households will remain under significant debt pressure next year, and the latest data shows that mortgage lending is still growing at 3 times income growth. We doubt that incomes will rise any time soon, and so 2018 will be a year of rising debt, and as a result, more households will get into difficulty and mortgage stress will continue to climb.  We think Treasury forecasts of rising household incomes are overblown. On the other hand, the costs of living will rise fast.

As a result, two things will happen. The first is that mortgage default rates are likely to rise (at current rock bottom interest rates, defaults should be lower), and if rates rise then default rates will climb further. The second outcome is that households will spend less and hunker down. As the Fed showed this week, the US economy is highly dependent on continued household spending to sustain economic growth – and the same is true here. We think many households will hold back on consumption, spending less on discretionary items and luxuries, and so this will be a brake on economic activity. This will have a strong negative influence on future economic growth, which we already saw throughout the Christmas shopping season.

Mortgage interest rates are likely to rise as international markets follow the US higher, lifting bank funding costs. This is separate from any change to the cash rate. This year the RBA was able to sit on its hands as the banks did their rate rises for them. We hold the view that the cash rate will remain stuck it its current rut for the next few months, because the regulators are acutely aware of the impact on households if they were to lift. They have little left in the tank if economic indicators weaken, and the bias will be upward, later in the year.

Competition for new loans will be strong, as banks need mortgages to support their shareholder returns. The latest credit data from the RBA showed that total mortgages are now at a record $1.71 trillion, and investor lending has fallen to an annual rate of 6.5%, compared with owner occupied lending at 6.3%, so total housing lending grew at 6.4%. Business lending is lower, at 4.7% and personal lending down 1.2%.

But APRA’s data shows that banks are writing less new business, so total Owner Occupied Balances are $1.041 trillion, up 0.56% in the month (so still well above income growth), while Investment Loans reached $551 billion, up 0.1%. So overall portfolio growth is now at 0.4%, and continues to slow. In fact, comparing the RBA and APRA figures we see the non-bank sector is taking up the slack, and of course they do not have the current regulatory constraints.  The portfolio movements of major lenders show significant variation, with ANZ growing share the most, whilst CBA shrunk their portfolio a little.  Westpac and NAB grew their investment loans more than the others.

We think there will be desperate attempts to attract new borrowers, with deeply discounted rates, yet at the same time mortgage underwriting standards will continue to tighten. We already see the impact of this in our most recent surveys. The analysis of our December 2017 results shows some significant shifts in sentiment –  in summary:

  • First, obtaining finance for a mortgage is getting harder – this is especially the case for some property investors, as well as those seeking to buy for the first time; and those seeking to trade up. Clearly the tightening of lending standards is having a dampening effect. As a result, demand for mortgage finance looks set to ease as we go into 2018 and mortgage growth rates therefore will slide below 6%.
  • Next, overall expectations of future price gains have moderated significantly, and property investors are now less expectant of future capital growth in particular. This is significant, as the main driver for investors now is simply access to tax breaks. As a result, we expect home prices to drift lower as demand weakens.
  • Mortgage rates have moved deferentially for different segments, with first time buyers and low LVR refinance households getting good deals, while investors are paying significantly more. This is causing the market to rotate away from property investors.
  • Net rental returns are narrowing, so more investors are underwater, pre-tax. So the question becomes, at what point will they decide to exit the market?

We see a falling expectation of home price rises in the next 12 months, across all the DFA household segments. Property Investors are clearly re-calibrating their views, and this could have a profound impact on the market. We see a significant slide in the proportion of property investors and portfolio investors who are looking to borrow more. First time buyers remain the most committed to saving for a deposit, helped by new first owner grants, while those who desire to buy, but cannot are saving less. Those seeking to Trade Up are most positive of future capital growth. Foreign buyers will be less active in 2018.

So our view is that demand for property will ease, and the volume of sales will slide through 2018. As a result, the recent price falls will likely continue, and indeed may accelerate. We will be watching for the second order impacts as investors decide to cut their losses and sell, creating more downward pressure. Remember the Bank of England suggested that in a down turn, Investment Property owners are four times more likely to exit compared with owner occupied borrowers.

So risks in the sector will grow, and bank losses may increase.

More broadly, banks will remain in the cross-hairs though 2018 as the Royal Commission picks over results from their notice requiring banks, insurance companies and superannuation funds to detail all cases of misconduct from 2008 onwards. We expect more issues will surface. The new banking code which was floated before Christmas is not bad, but is really still setting a low bar and contains elements which most customers would already expect to see. This is not some radical new plan to improve customer experience, rather more recognition of the gap between bank behaviour and customer expectation. And it does not HAVE to be implemented by the banks anyway.

There is much more work to do. For example, how about proactive suggestions to switch to lower rate loans and better rates on deposits?  What about the preservation of branch and ATM access? What about the full disclosure of all fees relating to potential loans?  And SME’s continue to get a raw deal thanks to lending policy and bank practice (despite the hype).

Then the biggie is mortgage lending policy, where banks current underwriting standards are set to protect the bank from potential loss, rather than customers from over-committing.

We will get to hear about the approach to Open Banking, the Productivity Commission on vertical integration and the ACCC on mortgage pricing, as well as the outcomes from a range of court cases involving poor banking behaviour. APRA will also discuss mortgage risk weights. So 2018 looks like adding more pressure on the banks.

So in summary, we think we will see more of the same, with pressure on households, pressure on banks, and a sliding housing market. Despite this, credit is growing at dangerous levels and regulators will need to tighten further.  We are not sure they will, but then the current issues we face have been created by years of poor policy.

Households can help to manage their financials by building a budget to identify their commitments and cash flows. Prospective mortgage borrowers should run their own numbers at 3% above current rates, and not rely on the banks assessment of their ability to repay – remember banks are primarily concerned with their risk of loss, not household budgets or financial sustainability per se. Regulators have a lot more to do here in our view.

Many will choose to spruke property in 2018 (we are already seeing claims that the Perth market “is turning”), and the construction sector, real estate firms, and banks all have a vested interest in keeping the ball in the air for as long as possible. Governments also do not want to see prices fall on their watch, and many of the states are totally reliant on income from stamp duty.  But we have to look beyond this. If we are very luck, then prices will just drift lower; but it could turn into a rout quite easily, and don’t think the authorities have the ability to calibrate or correct a fall if it goes, they do not.

The bottom line is this. Think of property as a place to live, not an investment play. Do that, and suddenly things can get a whole lot more sensible.

That’s the Property Imperative Weekly to 30th December 2017. We will return in the new year with a fresh weekly set of objective news, analysis and opinion. If you found this useful, do leave a comment, or like the post, and subscribe to receive future updates.  Best wishes for 2018, and many thanks for watching.

Some Segments Are More Likely To Buy, But Is It Enough?

Now, in our review of the results from our household surveys, we look at owner occupied purchasers. We start with “want to buys” – households who would like to purchase but cannot.  High home prices are the strongest barrier (31%), followed by availability of finance (27%), rising costs of living (17%) and concerns about interest rate rises (16%). Unemployment is not currently a major concern.

Turning to first time buyers, around 30% are buying for a place to live, while 17% are eying the potential capital gains (down from 31% a year ago). 15% are motivated by tax breaks, and 11% by the availability of first home owner grants (FHOG), up from 1% a year ago.  Greater security is also another factor (12%).

Turning to first time buyer barriers, the most significant challenge is problems with finance availability at 24.5% (compared with 11% a year ago), and house prices 41.1% (compared with 45.5% a year ago). Finding a place to buy is a little easier, down from 24% a year ago to 16% now.

Looking at the type of property they expect to purchase, we see a rise in city edge units, and suburban units, as more purchase an apartment not a house.  17% are not sure what to buy, compared with 22% a year ago.

Those seeking to refinance are driven a desire to reduce monthly payments (42%), 17% to withdraw capital, 18% for a better interest rate and 14% to lock in a fixed rate. Poor lender service is not a significant driver of refinancing.

Those seeking to sell and move down the market are seeking to release capital for retirement (41%), up from a year ago, 30% moving for great living convenience, and 10% because of illness or death of a spouse. Interestingly, the attraction of putting funds into an investment property has reduced from 23% a year ago to 16% now.

Finally, those seeking to trade up, 32% are doing so to get more space, 38% for investment purposes down from 43% a year ago, 17% for life style change and 13% for job change.

So the surveys highlight the lower appetite for investment property, the barriers limiting access to funds, and the desire to extract capital before prices fall much further.

Putting all this together, we think home prices are likely to fall further, as investor appetite continue to dissipate, and whilst there will be some first time buyer substitution, it will not be sufficient to keep prices high. Sydney, Brisbane and Melbourne markets are most likely to see a fall though 2018.  There is a risk of a more sustained fall if more property investors decide to cut their losses and try to lock in paper profits.


The Property Playing Field Is Tilting Away From Investors

Continuing our series on our latest household survey results, we look more deeply at the attitude of property investors, who over the past few years have been driving the market. We already showed they are now less likely to transact, but now we can look at why this is the case.

Looking at investors (and portfolio investors) as a group, we see the prime attraction is the tax effectiveness of the investment (negative gearing and capital gains tax) at 43% (which has been rising in recent times). But availability of low finance rates and appreciating capital values have both fallen this time around.  They are still driven by better returns than deposits (23%) but returns from stocks currently look better, so only 6% say returns from investment property are better than stocks! Only tax breaks are keeping the sector afloat.

We can also look at the barriers to investing. One third of property investors now report that they are unable to obtain funding for further property transactions, nearly double this time last year.

Then 32% say they have already bought, and are not in the market at the moment. Whilst concerns about more rate rises have dissipated a little, factors such as prices being too high, potential changes to regulation and RBA warnings all registered.

Turning to solo property investors (who own just one or two investment properties), 43% report the prime motivation is tax efficiency, 40% better returns than bank deposits and better returns than stocks (7%). But the accessibility of low finance rates and appreciating property prices have fallen away.

Those investing via SMSF also exhibit similar trends with tax efficiency at 43%, leverage at 16%, and better returns than deposits 14%. Once again, cheap finance and appreciating property values have diminished in significance.

We also see 23% of SMSF trustees get their investment advice from internet or social media sites, 21% use their own knowledge, while 13% look to a mortgage broker, 14% an accountant and 4% a financial planner. 15% will consult with a real estate agent and 9% with a property developer.

There is a fair spread of portfolio distribution into property. 13% have between 40-50% of SMSF investments in property, 29% 30-40% and 30% 20-30% of their portfolios.

Next time we will look at first time buyers and other owner occupied purchasers. Some are taking up the slack from investors, but is that sufficient to keep the market afloat?

Latest Survey Results Are In – The Great Property Rotation Is On

Digital Finance Analytics has completed the analysis of our latest household surveys, to December 2017. We see some significant shifts in sentiment, which we will discuss in more detail over the next few days. These results will inform our option of likely developments in 2018. But here is a summary.

  • First, obtaining finance for a mortgage is getting harder – this is especially the case for some property investors, as well as those seeking to buy for the first time; and those seeking to trade up. Clearly the tightening of lending standards is having a dampening effect. As a result, demand for mortgage finance looks set to ease as we go into 2018 and mortgage growth rates therefore will slide below 6%.
  • Next, overall expectations of future price gains have moderated significantly, and property investors are now less expectant of future capital growth in particular. This is significant, as the main driver for investors now is simply access to tax breaks. As a result, we expect home prices to drift lower as demand weakens.
  • Mortgage rates have moved deferentially for different segments, with first time buyers and low LVR refinance households getting good deals, while investors are paying significantly more. This is causing the market to rotate.
  • Net rental returns are narrowing, so more investors are underwater, pre-tax. So the question becomes, at what point will they decide to exit the market?

Here are some summary slides. We see a falling expectation of home price rises in the next 12 months, across all the DFA household segments. Property Investors are clearly re-calibrating their views, which could have a profound impact on the market. Those seeking to Trade Up are most positive of future capital growth.

First time buyers remain the most committed to saving for a deposit, while those who desire to buy, but cannot are saving less.

We see a significant slide in the proportion of property investors and portfolio investors who are looking to borrow more. We will explore the reasons for this change in a later post.

As a result, the proportion of investors expecting to transact in the next year has fallen. In fact, only Down Traders are slightly more likely to purchase than last time.

Finally, for today, we see minor changes in the intention to use a mortgage broker.

We continue to see a pattern where those seeking to refinance, and first time buyers are most likely to turn to a broker. Some other segments are less likely to use the channel to obtain a loan.

Next time we will look in more detail at the segment specific data. But we can certainly say there is strong evidence now that the property market is rotating, away from investors, and towards owner occupied borrowers.  There will be consequences for the market.


A Year In A Week – The Property Imperative 23 Dec 2017

In This Week’s Edition of the Property Imperative we look back over 2017, the year in which the property market turned, focus on the risks to households increased, and banks came under the spotlight as never before.

Welcome the penultimate edition of our weekly property and finance digest for 2017.

We start with the latest Government budget statement, which came out this week.  There was a modest improvement in the fiscal outlook, largely reflecting a boost in tax collections, including from higher corporate profits in the mining sector. But there was also a consumer shaped hole, driven by low wages, lower consumption and lower levels of consumer confidence. Yet, in the outlook, wages are predicted to rise back to 3%, and this supporting above trend GDP growth. This all seems over optimistic to me.

In any case, according to the IMF, GDP is a poor measure of economic progress, with its origins rooted firmly in production and manufacturing. In fact, GDP misrepresents productivity and they say companies that are making huge profits from mining big data have a responsibility to share their data with governments.

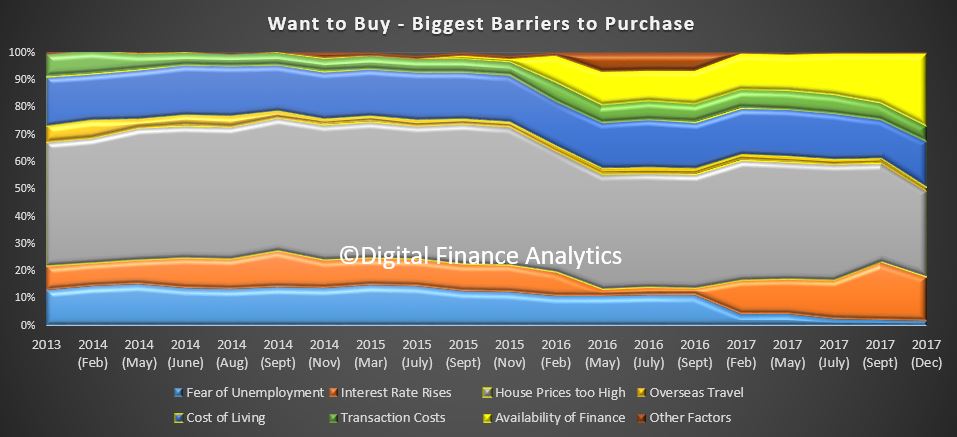
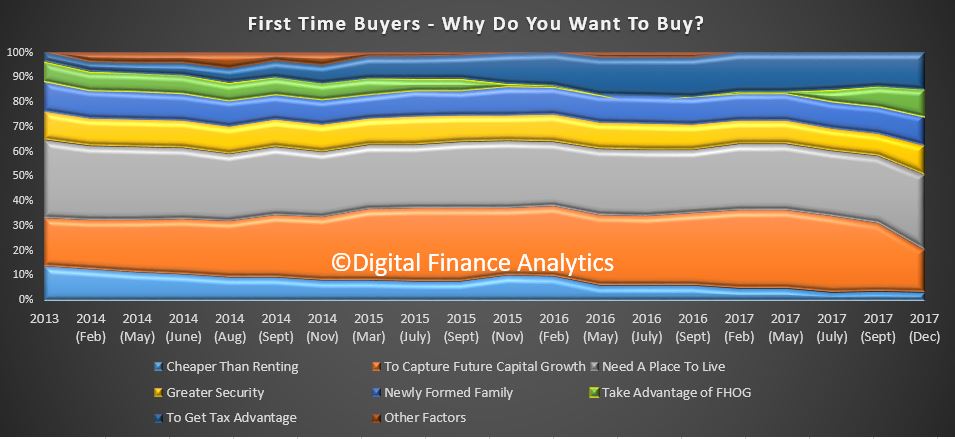
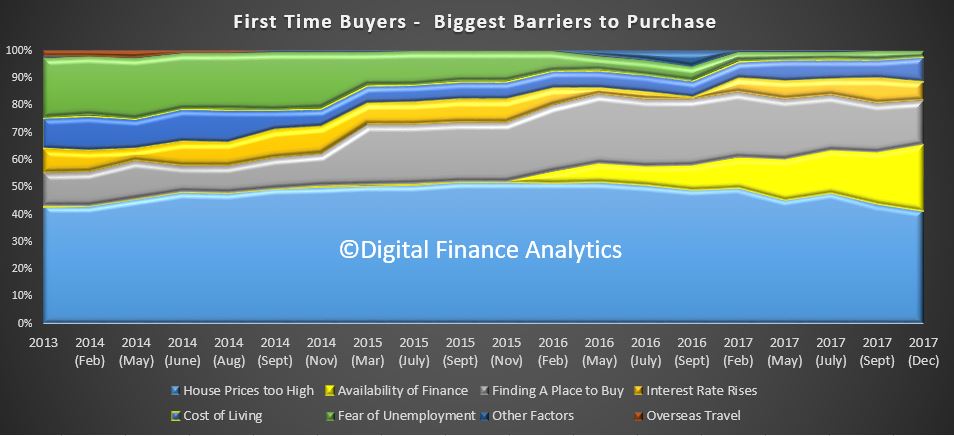
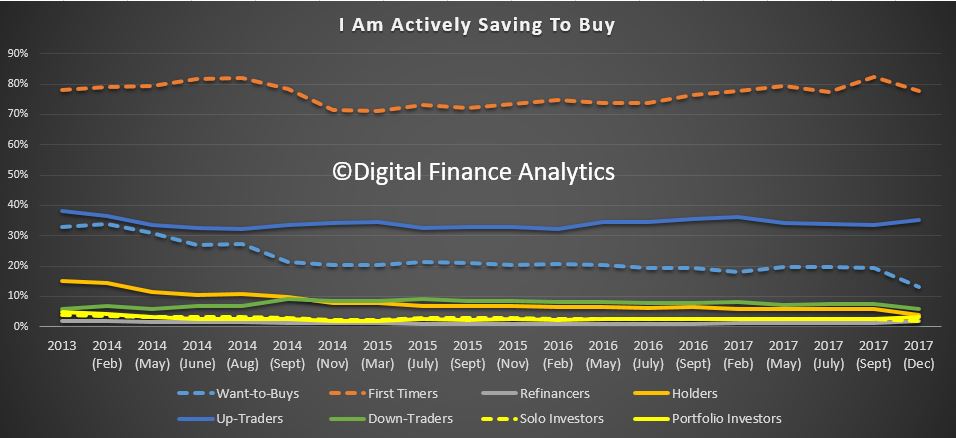
The mortgage industry has seen growth in lending at around 6% though the year, initially led by investors piling into the market, but then following the belated regulatory intervention to slow higher risk interest only lending, momentum has switched to first time buyers, at a time when some foreign buyers are less able to access the market. A third of customers with interest-only mortgages may not properly understand the type of loan they have taken out, which could put many in “substantial” stress when the time comes to pay their debt, UBS analysts have warned. We have also seen a change in mix, as smaller lenders and non-banks (who are not under the same regulatory pressure) have increased their share. AFG’s latest Competition index which came out yesterday, showed that Australia’s major lenders have taken a hit with their market share now down to a post-GFC low of 62.57% of the mortgage market.

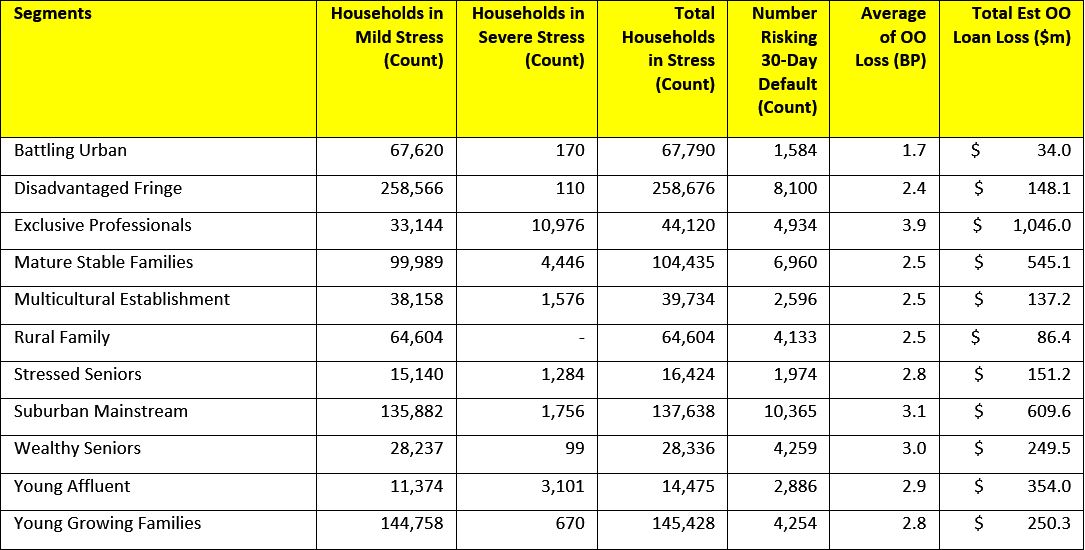
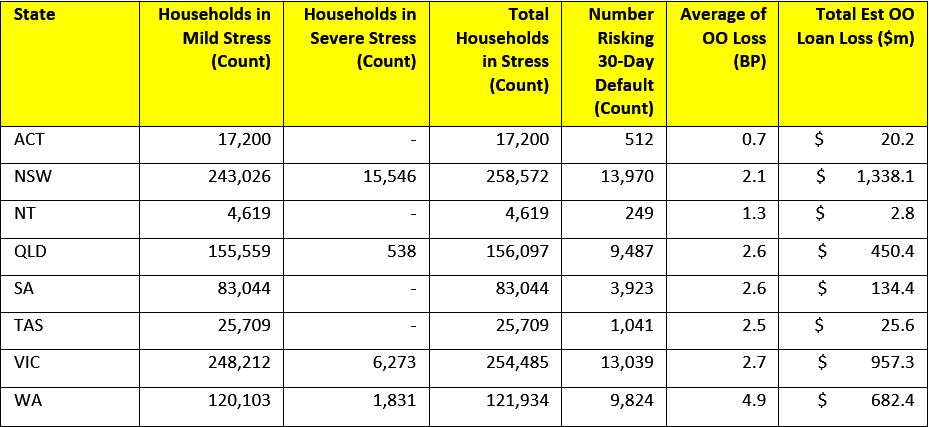
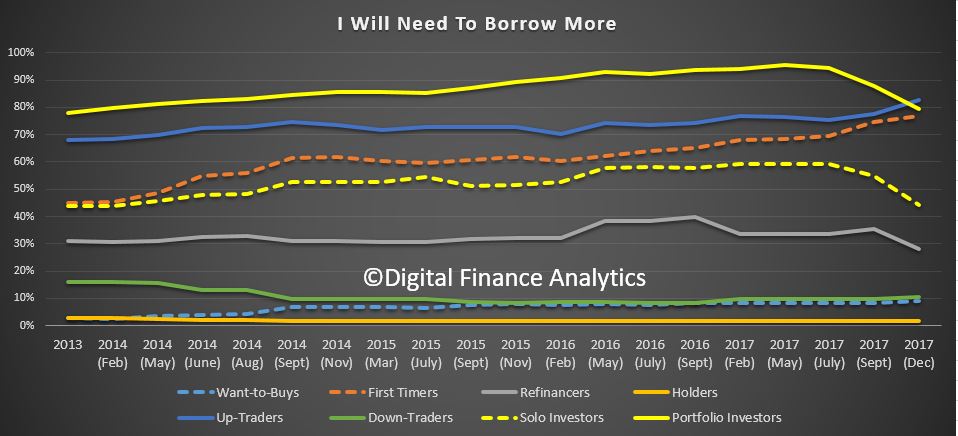
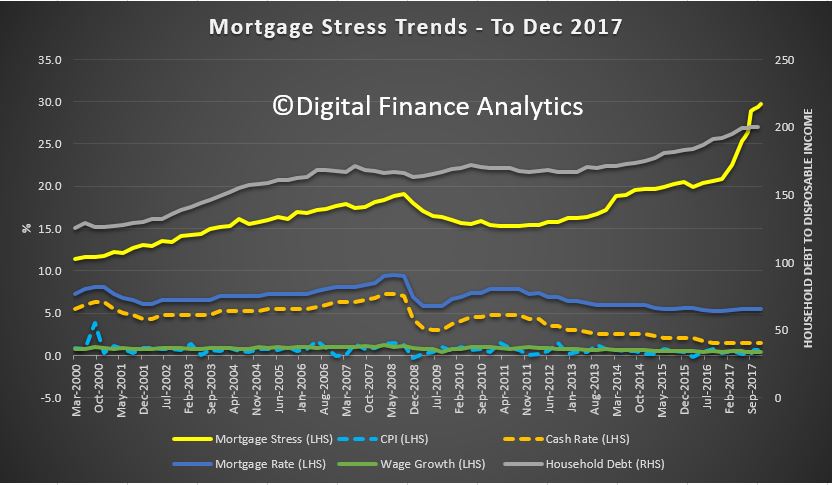
Household finances have been under pressure this year, with income growth, one third the rate of mortgage growth, so the various debt ratios are off the dial – as a nation we have more indebted households than almost anywhere else.  This is a long term issue, created by a combination of Government Policy, RBA interest rate settings, the financialisation of property, and the rabid growth of property investors – who hold 35% of mortgages (twice the proportion of the UK). The combination of rising costs of living, and out of cycle rate rises, have put pressure on many households as never before – and we have tracked the rise of mortgage stress through the year to an all-time high.

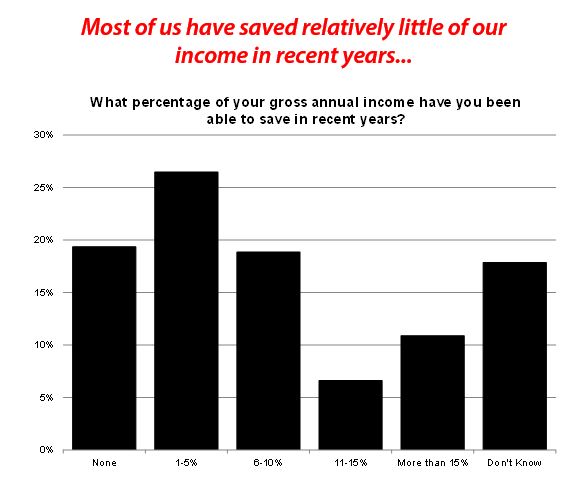
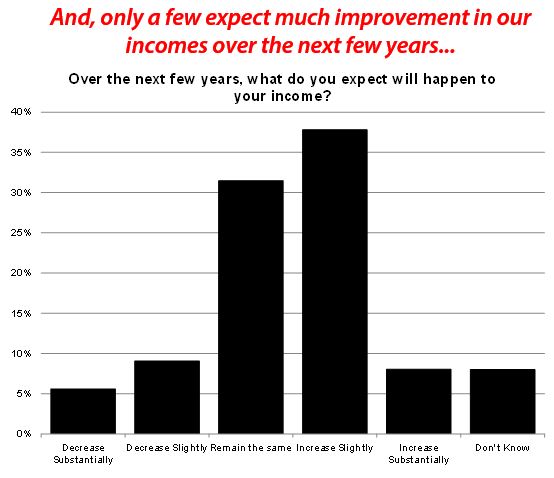
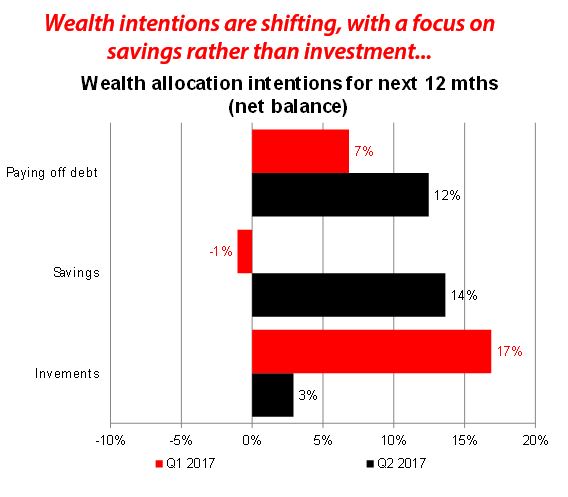
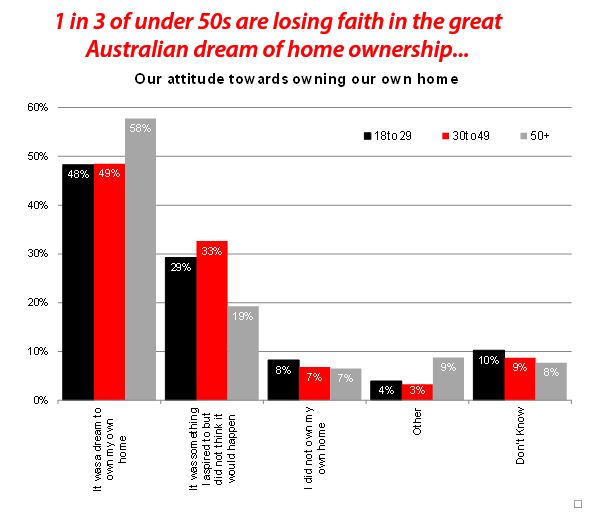
The latest MLC Wealth Sentiment Survey contained further evidence of the pressure on households and their finances. Being able to save has been a challenge for a number of Australians – almost 1 in 5 of us have been unable to save any of our income in recent years, and for more than 1 in 4 of us only 1-5%. Expectations for future income growth are very conservative – nearly 1 in 3 Australians expect no change in income over the next few years and 15% expect it to fall. Our savings expectations for the future are also very conservative – with more than 1 in 5 Australians believing their savings will fall. The “great Australian dream” of home ownership is still a reality for many, but for some it’s just a dream – fewer than 1 in 10 Australians said they didn’t want to own their own home, but 1 in 4 said home ownership was something they aspired to but did not think it would happen.

Of course the RBA continues on one hand to warm of risks to households, as in the minutes published this week, yet also persists with its line that households can cope, with the massive debt burden, as its skewed towards more wealthy groups. They keep referring to the HILDA survey, which is 3 years old now, as a basis for this assertion. They should take note of a Bank of England Working paper which looked at UK mortgage data in detail, and concluded the surveys tend to understand the true mortgage risks in the market – partly because of the methodology used.  They concluded “These results should make policy makers less sanguine about the developments in the UK mortgage market in recent years, which are traditionally analysed using these surveys”.

The latest report from S&P Global Ratings covering securised mortgage pools in Australia to end Oct 2017, showed 30-day delinquency fell to 1.04% in October from 1.08% in September. They attribute part of the decline to a rise in outstanding loan balances during the month, and many older loans in the portfolios (which may not be representative of all mortgages, thanks to the selection criteria for securitised pools). But 90+ defaults remain elevated – at a time when interest rates are rock bottom.

Banks are under the gun, as Government have turned up the pressure this year. There are a range of inquiries in train, from the wide-ranging Banking Royal Commission (which the Government long resisted, but then capitulated), and a notice requiring banks, insurance companies and superannuation funds to detail all cases of misconduct from 2008 onwards has also been issued. The scope includes mortgage brokers and financial advisers. Also the ACCC is looking at mortgage pricing, The Productivity Commission is looking at vertical integration, and we have the BEAR regime which is looking at Banking Executive Behaviour.  This week we also got sight of the Enhanced Financial Services Product Design Obligations, and of course the major banks copped the bank tax. There are also a number of cases before the Courts. This week, NAB said it had refunded $1.7 million for overcharging interest on home loans and CommInsure paid $300,000 following ASIC concerns over misleading life insurance advertising

This tightening across the board is a reaction to earlier period of market deregulation, privatisation and sector growth. But at its heart, the issue is a cultural one, where banks are primary focussing on shareholder returns (as a company that is their job), but at the expense of their customers.  Even now, the decks are stacked against customers, and the newly revised banking code of conduct won’t do much.  We think the Open Banking Initiative will eventually help to lift competition, and force prices lower. But, after many years of easy money, banks are having to work a lot harder, and with much more lead in the saddle bag. Meantime, it is costing Australia INC. dear.

More significantly, the revised Basel rules, though watered down, still tilts the playing field towards mortgage lending, and makes productive lending to business less attractive.  Also there is more to do on bank stress testing according to the Basel Committee. The regulation framework is in our view faulty.

One question worth considering, as the USA and other Central Banks lift their base cash rates, is whether there is really a “lower neutral rate” now. Some, in a BIS working paper have argued that Central Banker’s monetary policy have driven real interest rates lower, rather than demographics. But another working paper, this time from the Bank of England, comes down on the other side of the argument.  The paper “Demographic trends and the real interest rate” says two-thirds of the fall in rates is attributable to demographic changes (in which case Central Bankers are responding, not leading rates lower). In fact, pressure towards even lower rates will continue to increase. This is a fundamentally important question to answer. We suspect the role of Central Bankers in driving rates is less significant than many suspect, and structural changes are afoot.

Rates in Australia have stayed low this year, at 1.5%, despite the RBA saying this is below the neutral setting, and we expect the bank to move later in 2018, upwards. The rate of rise is now expected to be lower than a year ago, but the international pressure will be up. In addition, the US tax reforms will likely switch more investment to the US, and so banks, who rely on international funding, will likely have to pay more. So we still expect real rates to go higher ahead, creating more pressure on households. Also, of course as rates rise, the costs of Governments running deficits rises, something which will be a drag on the budget later.

Home prices continued to rise through 2017 in the eastern states, while in NT and WA they fell. Recent corrections in Sydney may be an indication of what is ahead in the Melbourne market too. Demand remains strong, but lending standards have been tightened, and investors are getting more concerned about future capital appreciation. This year building approvals were still pretty strong, in line with firm population growth. As an aside, an OECD report this week said that Australian property may well be a target for money laundering, and more needs to be done to address this issue.  Auction volumes continue to slide, and we have seen a significant fall in recent weeks.

So, this year we have seen changes in the financial services landscape, the property market is on the turn, and household’s debt levels are rising, creating financial stress for many. As a result, we expect many to spend less this Christmas.

Next time we will discuss the likely trajectory through 2018, but we wanted to wish all our followers a peaceful and restful holiday season. We have really appreciated all the interest in our work – through the year we have more than doubled our readership, thanks to you.

Many thanks for watching. Check back next week for our views on what 2018 may bring.

Saving Less, Income Flat, Home Ownership Dream Fading – MLC

The latest MLC Wealth Sentiment Survey contains further evidence of the pressure on households and their finances.

Being able to save has been a challenge for a number of Australians – almost 1 in 5 of us have been unable to save any of our income in recent years, and for more than 1 in 4 of us only 1-5%.

Expectations for future income growth are very conservative – nearly 1 in 3 Australians expect no change in income over the next few years and 15% expect it to fall.

So, not surprisingly, our savings expectations for the future are also very conservative – with more than 1 in 5 Australians believing their savings will fall.

The “great Australian dream” of home ownership is still a reality for many, but for some it’s just a dream – fewer than 1 in 10 Australians said they didn’t want to own their own home, but 1 in 4 said home ownership was something they aspired to but did not think it would happen. Young people still have broadly similar aspirations around home ownership as middle-aged Australians.

Most of us wait and save more before buying our first home and many are prepared to buy some way out of the city – almost 1 in 3 would/did wait longer to have a bigger deposit, and 1 in 4 would live in a suburb some way out of the city to purchase their first home. Around 16% would live in an apartment and 12% further away from work and family or a regional area.

Most Australians don’t plan to or are unwilling to use the family home to fund their retirement – only 18% would be willing to use the family home to fund their retirement either by selling it or using part of their home as equity. The average Australian home owner has around $547,000 of equity in the family home.