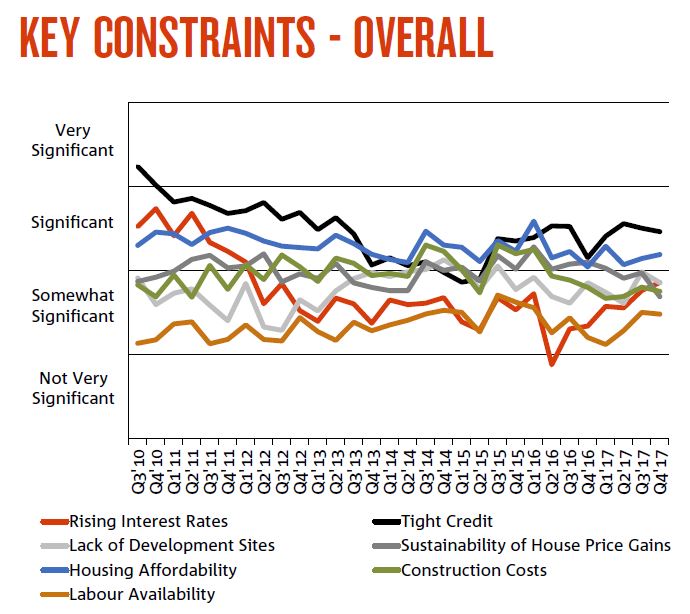
NAB released their Q4 2017 Property Survey. They see property prices easing as foreign buyers lose interest, and a big rotation from the east coast. Tight credit will be a significant constraint.
National housing market sentiment (measured by the NAB Residential Property Index) was unchanged in Q4, as big gains in SA/NT and WA (but still negative) offset easing sentiment in the key Eastern states (NSW and VIC).
Confidence levels also turned down, led by NSW and VIC, but SA/NT a big improver. SA/NT is now also the only state expected to record faster house price growth over the next 1-2 years, but prices are expected to grow fastest in QLD and fall in NSW. Income yields should however improve over the next 1-2 years as rental expectations exceed house prices in most states except QLD and WA. First home buyers (especially those buying for owner occupation) continue raising their profile in new and established housing markets, with their share of demand reaching new survey highs.
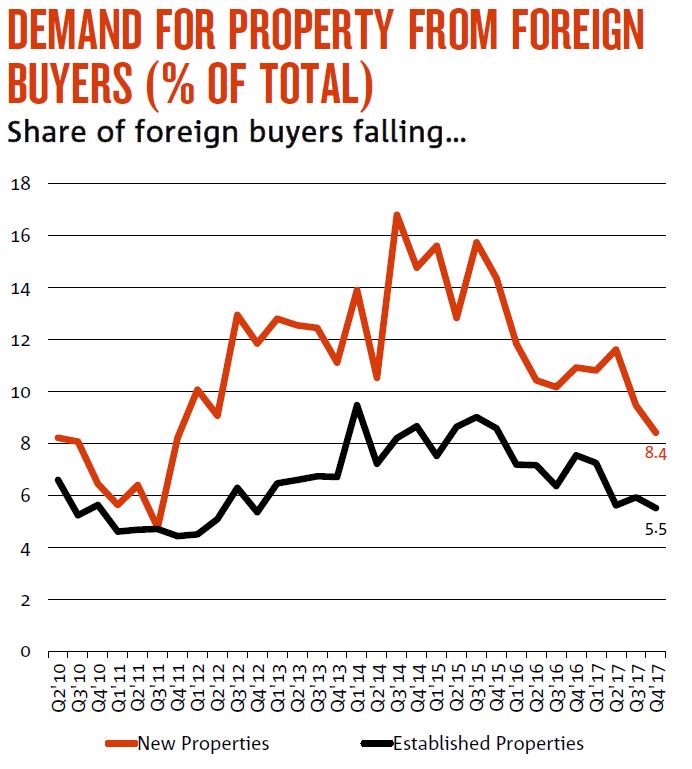
In contrast, the share of foreign buyers continued to fall in all states, except QLD (new property) and VIC (established housing), with property experts predicting further reductions over the next 12 months.
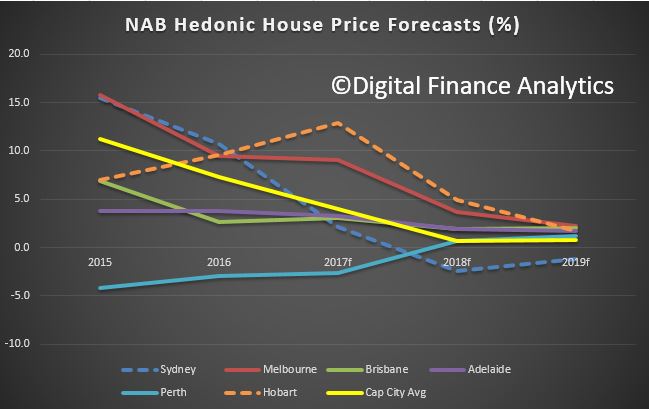
NAB’s view for 2018 is largely unchanged, but the degree of moderation has been ramped up – driven by revisions to Sydney. House prices are forecast to rise 0.7% (previously 3.4%) and remain subdued in 2019 (0.8%).
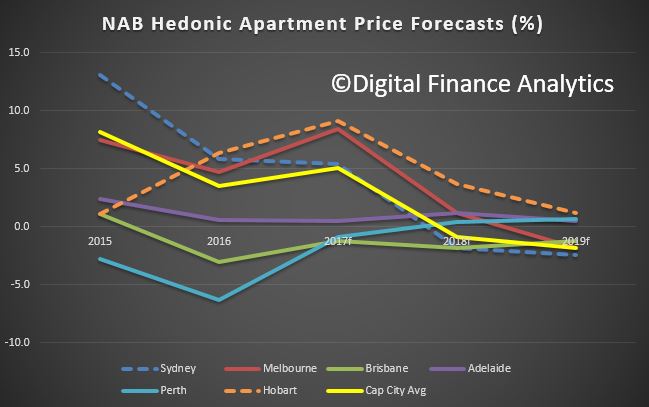
Apartments will under-perform, reflecting large stock additions and softer outlook for foreign demand.
Real estate sales companies are using big commissions to tempt mortgage brokers, financial planners and accountants to sell overpriced properties to unsuspecting clients. Here is the segment from ABC The Business.
It is a business model that has been operating for years, but is raising more concern now that many of Australia’s largest property markets are heading for a potential apartment glut.
Developers generally contract out sales to these companies when they are having difficulty shifting their stock, such as when there is an oversupply of new apartments or houses in the area.
Real estate agents say developers use these sales companies, which often market themselves as property investment firms, because they can achieve higher-than-market prices.
One reason the properties are so far above market prices is to cover the cost of the commissions going to the marketing firm.
Those fees can add tens of thousands of dollars to the cost of a new apartment or house.
A large part of those commissions are often then passed on to mortgage brokers, accountants or financial planners who refer their clients to the marketing firms.
The Real Estate Institute of Australia (REIA) said it has been “ferociously lobbying” both the federal and state governments to impose more regulation on this type of property sales tactic.
In the meantime, the REIA’s president, Malcolm Gunning, said clients need to do their homework if offered a property deal that sounds too good to be true.
“This is really aimed at, I suppose, the new investor or the lazy investor who really doesn’t want to go out and do their own due diligence,” he said.
“You should always cross-check. You should go off, walk down to your local real estate agent who’s been there for 25 years and say, ‘if I buy this property, what rent can I get for it and what in your opinion is the current market value?’
“So at least you’re making an informed decision. Don’t rely just on one source of information.”
So if an adviser or broker tries to sell you a property investment, it is worth asking who is paying theirs.
So, we have new data from both CoreLogic and Domain on home price growth. The problem is we are getting somewhat different results, driven presumably by their different methodologies. But is does make it hard to decode the true story in some locations. Trends are still pointing down though.
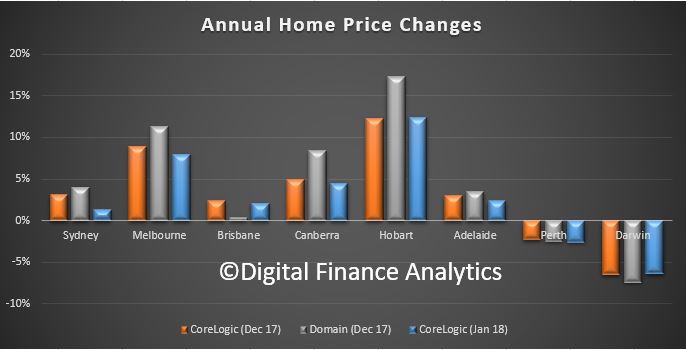
Here is a plot of changes in values over the past year, based on CoreLogic’s December 2017 and January 2018 data, and the December 2017 data from Domain.
Domain looks more bullish in the eastern states, Brisbane apart. Corelogic is showing a fall between December and January in most east coast states.
Hobart is the winner, but is it 17% or 12%, a large variation. And is Canberra 8% or 4%?
Perth and Darwin and stuck in negative territory.
My take out is that these numbers are dynamic, and should not be taken too seriously, though the trend is probably the best indicator.
Perhaps their respective analysts can explain the variations. I for one would love to understand the differences.
Its a pity we have to wait so long for the ABS price data. But then again, that just adds another data point, which does not directly match.
The latest data from Domain highlights the difference between the Sydney and Melbourne home prices movements. The question is, will Melbourne follow Sydney’s lead, and slow in the months ahead, or chart a different path?
Sydney’s median house price, $1,179,519, increased by 0.5 per cent over the quarter and 4 per cent over the year.
HSBC chief economist Paul Bloxham said Sydney was getting less support from international and domestic migration compared with Melbourne. “A cooling in investor interest has also been more apparent in the Sydney market.”
The gap between house prices in Melbourne and the harbour city continues to narrow. Over the latest quarter the difference was reduced to $276,000, the lowest in three years.
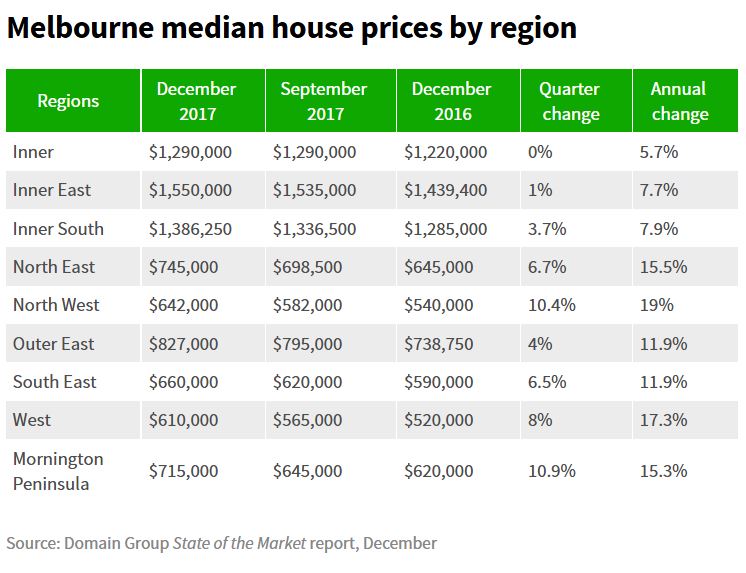
Melbourne’s median shot up 3.2 per cent to $903,859 in the December quarter, according to the Domain Group’s latest State of the Market report. Prices have risen every quarter for nearly five and a half years.
Market Economics managing director Stephen Koukoulas said “even though there has been a bit of a tightening in credit for investors, in terms of the amount that is lent and interest-only loans, it doesn’t appear to have had a significant impact in Melbourne”.
Melbourne was again a strong performer compared to most other capital cities, with only Hobart and Canberra posting higher growth.
Domain Group data scientist Nicola Powell said Melbourne’s most affordable regions — the west, north west and south east — had recorded the strongest price growth off the back of heightened first-home buyer activity.
Worth also noting that the strongest growth areas are also the highest in terms of mortgage stress, according to our analysis. So household debt remains extended, and the risks are rising.
Even in the CBD, a market many consider to be overheated, prices for apartments climbed 1.9 per cent over the December quarter,. But compare this to a significant fall in Brisbane apartments, so it is important to get granular when examining the data.
Brisbane unit prices have continued their downward slide, down to $385,955; a fall of 2.2 per cent for the quarter and 4.4 per cent for the year. Here units are actually at a four-year low, it’s the steepest yearly fall since June 2001. Domain says “we’re starting to see developers start to respond to the oversupply, they’re delaying some projects and not starting some either”. Greater Brisbane’s lacklustre performance, as revealed in the latest Domain Group State of the Market Report, shows median house prices have fallen by 0.6 per cent across the five LGAs, which include Brisbane, Ipswich, Redland, Moreton Bay and Logan, to $548,918.
Hobart has been declared the unlikely star of Australia’s 2017 property market, charting a stellar 17.3 per cent growth rate in house prices, putting the usual mainland glitterati into the shade. Domain Group data scientist Dr Nicola Powell agrees. The strong inter-state migration to Hobart for both lifestyle reasons and the affordability of homes is driving up prices steadily to today’s record Hobart median house price of $443,521, she believes. And with the latest December 2017 quarter alone showing a price surge of 10 per cent, there’s no relief in sight.
Domain reports Canberra’s median house price surged by 5 per cent over the December quarter to a new record high of $753,516. The Canberra growth rate was the highest recorded of all the capitals with the exception of Hobart where the median increased by 10 per cent over the quarter.
But the resources slump turned Darwin into the country’s worst performer with a 7.4 per cent drop in its median house price to $565,696 and a 14 per cent plunge in its unit price to $395,279. It also hit Perth, with a house median fall of 2.5 per cent to $557,567, and its units 1.7 per cent to $369,402.
Perth’s median house price grew 0.5 per cent to $557,567 during the December quarter. However, prices fell 2.5 cent compared with the previous year. In the unit market, median prices grew one per cent to $369,402 – a 1.7 per cent decline year-on-year.
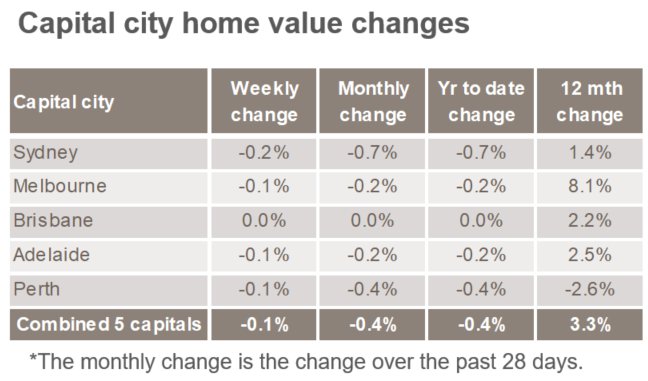
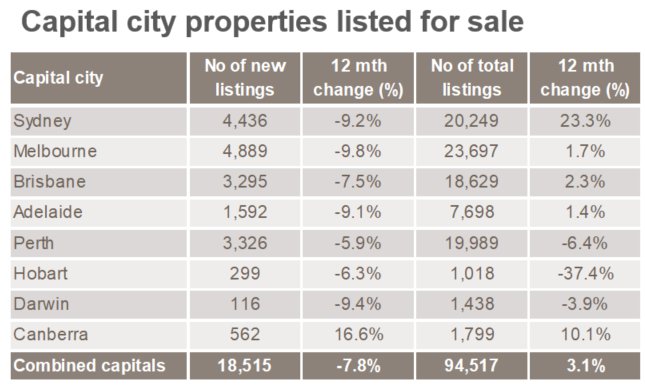
The latest CoreLogic index data continues to underscore a slide in prices, and a rise in property listed in the main centres.
Sydney continues its slowing trend, Melbourne is following, and Perth is lower.
The number of properties listed continues to rise in Sydney and Canberra most notably.
Many are arguing this is just a “blip” over the holiday period, and things will return to normal as the autumn season kicks off. However, we are less sure, given the changed lending environment, and expectations from property investors. The next month or so will provide a better lens on longer term prospects.
CoreLogic also makes the point that:
The combined capital city auction clearance rate fell to 62.3 per cent over the December quarter, down from 67.8 per cent over the September quarter.
Clearance rates are down across all but two capital cities over the December quarter, with Sydney recording the largest fall, down from 66.8 per cent to 57.7 per cent. Brisbane and Adelaide were the only cities where clearance rates didn’t fall, with both cities increasing by just 0.2 per cent over the December quarter. Melbourne recorded the highest clearance rate over the quarter at 68.1 per cent, down from 72.6 per cent the previous quarter, followed by Canberra at 66.3 per cent. Overall, the combined capital city clearance rate for the December quarter is lower on both a quarterly and annual basis.
We get a steady flow of questions from those who read our research, or follow our posts, but one question, more than any other we get asked is – Should I Buy Property Now? Many cite the real estate industry claims that now is a great time to buy – but is it really? Today we are going to explore this question, but with a caveat. This is NOT financial advice, and is simply my opinion, based our own research and surveys. Your mileage may vary. The market is different across states and locations.
Watch the video or read the transcript.
But it is an important question given that home prices appear to have reached something of a peak, and may be sliding in some areas; housing is Australia is unaffordable, as the recent Demographia report showed; banks are tightening their lending standards under regulatory pressure; net rental streams are looking pretty stressed; many households are under severe financial pressure, and mortgage interest rates are likely to rise.
In fact, we have a generation of home buyers and prospective home buyers who have only ever seen home values rise, and if you are in the property owning system, is has become a significant source of wealth creation, amplified if you are a property investor, and assisted by ultra-low interest rates, tax breaks and other incentives. But will the good times continue to roll? Not necessarily.
So to decide if now is a good time to buy, consider these questions.
First, why do you want to buy a property? Up until recently, our surveys have shown the number one reason to buy was capital appreciation and wealth building, with finding somewhere to live a poor second. But now, if you are wanting to buy to grow wealth, we say be careful, as the market dynamics are changing, and its likely prices will slide. Also there may be changes to negative gearing under a Labor government, and property investment mortgage rates are likely to rise, while rental streams are not, so more investment properties, on a cash flow basis will be under water. At the moment there are much better returns from the buoyant stock market, though of course that may change. Remember that prices crashed by 40% in Ireland, 35% in the USA and 25% in UK after the GFC. Prices can go down as well as up. Property is not a one-way bet!
But, if you are seeking to buy, for somewhere to live, and capital growth is less important to you, then it may still be a good time to transact. Prices are already down, and many sellers are accepting deeper discounts off the asking price to make a deal. In addition, if you are a first time buyer, there are state incentives and really low mortgage rates available. But remember you are still buying into a highly unaffordable market, and the capital value of your property may fall. This could turn into a paper loss, and indeed should you need to sell, a real financial hit. The way a mortgage works is you put in a deposit, and the bank lends the rest. But in a falling market, it is your deposit which is eroded. After the GFC many households in the northern hemisphere ended up in negative equity, meaning the value of their mortgage was larger than the market value of their property. As a result, people were stuck living in their properties unable to move, hoping the market would rise again. In fact, it did over the next 10 years, so now many are no longer in negative equity. But it can be a long and winding road.
Next, if you do decide to buy, do the work. First look around at property available, and recent sales, to get a sense of the market. Also look in different areas, and even different states. Often locations a little further from public transport are cheaper – but then is the trade-off worth it? Also compare new builds with existing property. Often newly constructed homes carry a premium, which just like a new car, on first use falls away. On the other hand, there are some desperate builders out there, with big projects, and few buyers, especially in the high-rise belts of Brisbane, Melbourne and Sydney, so they may do a deal. We are seeing a steady stream of people who sign up for off the plan builds, but then when it comes to getting a mortgage, they cannot find one, so cannot complete. So read the small print on these contracts. Ask yourself, what happens if you cannot complete the transaction.
It is also harder to add any value to a new property, whereas an older one may offer more potential for investment and upgrade, and this can be a way of helping to preserve value. There is an old adage – buy the worst property on the best street. This is still true, with caveats – you should check the condition of the property so you know what you are up for.
Also, do the work when it comes to a mortgage. Our research shows you can often get better mortgage rates from some of the smaller customer owned lender, as opposed to the big four by going direct to them. So shop around. Whilst using a broker may help, again we find that some of the best rates are found by borrowers who do the work themselves. Many brokers will do the right thing, and really help, but there is a risk that the commission and ownership structure of broker firms may mean they do not have access to the best rates, and they may not always be working in your best interests, so be careful.
There is more work to do also, on affordability. A lender will make an offer of a mortgage, based on your financial details as contained in the application, and supporting evidence. Remember lenders want to make a loan – it is the only game in town in terms of their profitability – but there is evidence that some lenders will offer a bigger loan, by using more aggressive living expenses, and income assumptions. That said, the industry is getting more conservative, with lower allowable loan to value ratios, and some income categories now reduced.
Just because the lender says you can have a loan, does not mean you should get the loan. The lender is looking at risk of loss from their perspective, not yours. If you have a large deposit, then the bank can assume that capital is available on default to recover their mortgage. Remember in Australia, you cannot just walk away and return the keys, the liability stays with you. So, ask the lender, not just about repayments at current interest rates, but also what happens if they rise. A good rule of thumb is catering for a 3% rise in rates. Get the lender to tell you what the revised repayments would be at this higher rate, and ask yourself if you could still make the repayments. This is important, as incomes are not growing in real terms and mortgage rates may well rise. If you cannot make the repayments at 3% high, get a smaller loan, and buy a smaller place.
You may need to build your own cash flow to test what is affordable – again do not rely on the bank for this – remember they are concerned about risk of loss to their shareholders, not to you. ASIC’s MoneySmart Budget Planner is a good starting point. Also, remember to include the transaction and stamp duty costs in your calculations.
Another area is the deposit you will need. These days you are likely to need a bigger deposit. 20% would be a good target, as this then avoids having to pay for expensive Lenders Mortgage Insurance. Above that, you will need this facility – which to be clear, protects the bank, not you!
More prospective borrowers are turning to the Bank of Mum and Dad, for help, but there are also risks attached to this arrangement – see our earlier Video Blog on the Bank of Mum and Dad. Some buyers are clubbing together to purchase, but there are risks attached to these arrangements too.
Finally, if you do buy, work on the assumption you will need to hold the property for some time – say a minimum of 3-5 years. The old trick of flicking after a year or so will not work if, as we expect prices fall. Remember too that there are additional costs to owning a property from council rates, running costs – such as electricity – and maintenance costs. Owning property is an expensive business. Make sure these costs are included in your cash flows.
So what’s the bottom line? If you are wanting to buy to put shelter over your family’s head, and can afford the mortgage, and are willing to accept a risk of loss of capital, then do the work, and it might be the right thing to do. A capital gain is by no means certain in the current climate!
But, if you are looking at property as a wealth building tool, I think you might do better to hold off, as prices are likely to slide, and the costs of an investment mortgage are on the rise. At very least look in areas around Hobart and Adelaide where value is better at the moment.
In fact, though, the only reason I can see to transact in this case is to lock in a negative gearing arrangement now, before the next Federal election. But then, that seems to me to be a long bow, and our modelling suggests that the removal of negative gearing will have only a minor impact on the market. There are a bunch of other more compelling reasons to think the market will fall.
So in summary, whatever type of borrower you are, do the work and be very careful. Prices may rise, but they can also certainly fall, and a mortgage could just be a noose around your neck.
If you found this useful, do like the post, leave a comment, and subscribe to receive future updates. Keep an eye out for our upcoming special post on Cryptocurrencies and Bit Coin.
Housing in Australia is severely unaffordable, and despite the growth in jobs, unemployment in some centres is rising. We look at the evidence. Welcome the Property Imperative Weekly to 27th January 2018.
Thanks to checking out this week’s edition of our property and finance digest. Watch the video or read the transcript.
Today we start with employment data. CommSec looked at employment across regions over the last year. Despite the boom in jobs, the regional variations are quite stark, with some areas showing higher rates of unemployment, and difficult economic conditions. Unemployment has increased in several Queensland regional centres in recent years. Queensland’s coastal regional centres such as Bundaberg, Gympie, Bundaberg and Hervey Bay, known more broadly as Wide Bay (average 9.0 per cent), together with Townsville (albeit lower at 8.5 per cent) have elevated jobless rates. Unemployment also increased along the suburban fringes and city ‘spines’ such as Ipswich (8.1 per cent) in Brisbane and the western suburbs of Melbourne (9.0 per cent). In Western Australia, Mandurah, south of Perth, experienced a significant decline in the jobless rate to an average of 7.0 per cent in December from 11.2 per cent a year ago. Higher income metropolitan areas, especially in Sydney’s coastal suburbs, dominate the regions with the lowest unemployment rates. However, the corridor between Broken Hill and Dubbo has Australia’s lowest regional unemployment rate at 2.9 per cent, benefitting from agricultural, tourism and mining-related jobs growth. You will find there is a strong correlation with mortgage stress, as we will discuss next week.
The Victorian Government has reaffirmed their intent to shortly accept applications for its shared equity scheme known as HomesVic from up to 400 applicants. We do not think such schemes help affordability, they simply lift prices higher, but looks good politically. This was first announced in March 2017. The $50-million pilot initiative aims to make it easier for first-home buyers to enter the market by reducing the size of their loan, hence reducing the amount they need to save for a deposit. The initiative targets single first-home buyers earning an annual income of less than $75,000 and couples earning less than $95,000. Eligible applicants must buy in so-called “priority areas” which include 85 Melbourne suburbs, seven fringe towns and 130 regional towns and suburbs. In Melbourne, the list includes suburbs around Box Hill, Broadmeadows, Dandenong, Epping, Fishermen’s Bend, Footscray, Fountain Gate, Frankston, LaTrobe, Monash, Pakenham, Parkville, Ringwood, Sunshine and Werribee. Regional centres on the list include Ballarat, Bendigo, Castlemaine, Geelong, La Trobe, Mildura, Seymour, Shepparton, Wangaratta, Warrnambool and Wodonga. The state government said the locations were chosen in growth areas where there was a high demand for housing and access to employment and public transport. Some of these locations are where mortgage stress, on our modelling is highest – we will release the January results next week. The scheme is not available in most of Melbourne’s bayside suburbs, the leafy inner eastern suburbs or some pockets of the inner north.
Overseas, the US Mortgage Rates continue to rise, heading back to the worst levels in more than 9 months. Rates have risen an eighth of a percentage point since last week, a quarter of a point from 2 weeks ago, and 3/8ths of a point since mid-December. That makes this the worst run since the abrupt spike following 2016’s presidential election. While this doesn’t necessarily mean that rates will continue a linear trend higher in the coming months, the trajectory is up, reflecting movements in the capital markets, and putting more pressure on funding costs globally.
The Bank for International Settlements (BIS) has published an important report “Structural changes in banking after the crisis“. The report highlights a “new normal” world of lower bank profitability, and warns that banks may be tempted to take more risks, and leverage harder in an attempt to bolster profitability. This however, should be resisted. They also underscore the issues of banking concentration and the asset growth, two issues which are highly relevant to Australia. The report says that in some countries the 2007 banking crisis brought about the end of a period of fast and excessive growth in domestic banking sectors. Worth noting the substantial growth in Australia, relative to some other markets and of particular note has been the dramatic expansion of the Chinese banking system, which grew from about 230% to 310% of GDP over 2010–16 to become the largest in the world, accounting for 27% of aggregate bank assets.
Back home, an ASIC review of financial advice provided by the five biggest vertically integrated financial institutions (the big four banks and AMP) has identified areas where improvements are needed to the management of conflicts of interest. 68% of clients’ funds were invested in in-house products. ASIC also examined a sample of files to test whether advice to switch to in-house products satisfied the ‘best interests’ requirements. ASIC found that in 75% of the advice files reviewed the advisers did not demonstrate compliance with the duty to act in the best interests of their clients. Further, 10% of the advice reviewed was likely to leave the customer in a significantly worse financial position. This highlights the problems in vertically integrated firms, something which the Productivity Commission is also looking at. The real problem is commission related remuneration, and cultural norms which put interest of customers well down the list of priorities.
The Financial Services Royal Commission has called for submissions, demonstrating poor behaviour and misconduct. It will hold an initial public hearing in Melbourne on Monday 12 February 2018. The not-for-profit consumer organisation, the Consumer Action Law Centre (CALC) said the number of Aussie households facing mortgage stress has “soared” nearly 20 per cent in the last six months, and argued that lenders are to blame. Referencing Digital Finance Analytics’ prediction that homes facing mortgage stress will top 1 million by 2019, CALC said older Australians are at particular risk. The organisation explained: “Irresponsible mortgage lending can have severe consequences, including the loss of the security of a home. “Consumer Action’s experience is that older people are at significant risk, particularly where they agree to mortgage or refinance their home for the benefit of third parties. This can be family members or someone who holds their trust.” Continuing, CALC said a “common situation” features adult children persuading an older relative to enter into a loan contract as the borrower, assuring them that they will execute all the repayments. “[However] the lack of appropriate inquiries into the suitability of a loan only comes to light when the adult child defaults on loan repayments and the bank commences proceedings for possession of the loan in order to discharge the debt,” CALC said. We think poor lending practice should be on the Commissions Agenda, and we will be making our own submission shortly.
The latest 14th edition of the Annual Demographia International Housing Affordability Survey: 2018, continues to demonstrate the fact that we have major issues here in Australia. There are no affordable or moderately affordable markets in Australia. NONE! Sydney is second worst globally in terms of affordability after Hong Kong, with Melbourne, Sunshine Coast, Gold Coast, Geelong, Adelaide, Brisbane, Hobart, Perth, Cains and Canberra all near the top of the list. You can watch our separate video where we discuss the findings and listen to our discussion with Ben Fordham on 2GB. When this report comes out each year, we get the normal responses from industry, such as Australia is different or the calculations are flawed. I would simply say, the trends over time show the relative collapse in affordability, and actually the metrics are well researched.
Fitch Ratings published its Global Home Prices report. They say price growth is expected to slow in most markets and risks are growing as the prospect of gradually rising mortgage rates comes into view this year. Their data on Australia makes interesting reading. Fitch expects Sydney and Melbourne HPI to stabilise in 2018, due to low interest rates, falling rental yields, increasing supply, limited investment alternatives and growing dwelling completions, partially offset by high population growth. Fitch expects the increase in FTB to be temporary; low income growth, tighter underwriting and rising living costs will maintain pressure on affordability for FTB. As mortgage rates are currently low, any material rate rise will weigh further on mortgage affordability and serviceability. The rising cost of living and sluggish wage growth are likely to increase pressure on recent borrowers who have little disposable income. Fitch expects mortgage lending growth to slow to around 4% in 2018, based on continued record low interest rates and stable unemployment. This will once again be offset by continued underemployment, reduced investor demand and tougher lending practices.
Finally, the latest weekly data from CoreLogic underscores the weakness in the property market. First prices are drifting lower, with Sydney down 0.4% in the past week and Melbourne down 0.1%. The indicator of mortgage activity is also down, suggesting demand is easing as lending rules tighten. But then we always have a decline over the summer break. The question is, are we seeing a temporary blip, over the holiday season, or something more structural? We think the latter is more likely, but time will tell.
So that’s the Property Imperative Weekly to 27th January 2018. If you found this useful, do like the post, add a comment and subscribe to receive future editions. Many thanks for taking the time to watch.
Our latest Video Blog discusses the Demographia Housing Affordability Report with specific reference to Australia.
The latest 14th edition of the Annual Demographia International Housing Affordability Survey: 2018, using 3Q 2017 data continues to demonstrate the fact that we have major issues here. There are no affordable or moderately affordable markets in Australia. NONE!
We discussed the latest Demographia report and housing affordability on 2GB today, with Ben Fordham. There are no affordable or moderately affordable markets in Australia. NONE! We have a structural problem.
Globally, national house prices are forecast to rise this year in 19 of 22 markets highlighted by Fitch Ratings in a new report, but growth is expected to slow in most markets and risks are growing as the prospect of gradually rising mortgage rates comes into view this year. Their data on Australia makes interesting reading.
Home Prices: Growth Decelerates
Combined capital city home prices showed yoy growth of 6.6% in the year to November 2017, down from 10.9% over the year to December 2016. The increase was driven by Hobart (+12.7%), Melbourne (+11.0%) and Sydney (+7.7%). Melbourne and Sydney experienced slower growth while Hobart experienced faster growth than a year earlier. Continued record low interest rates have supported price growth while gross rental yields slipped to a record low of 3.6% as of October 2017. Tighter lending standards and foreign ownership restrictions have dampened price growth however.
Fitch expects Sydney and Melbourne HPI to stabilise in 2018, due to low interest rates, falling rental yields, increasing supply, limited investment alternatives and growing dwelling completions, partially offset by high population growth.
Affordability: First-Home Buyers Back in the Market FTBs increased to 17.4% of owner-occupied lending in September 2017 from 13.1% in September 2016, after FTB grants were introduced in New South Wales and Victoria in July 2017. The state governments of Australia’s two most populous states have introduced new FTB support, such as abolished stamp duty for properties up to AUD650,000, reduced stamp duty for properties up to AUD800,000, and grants of up to AUD20,000 for the building of new homes.
Although FTB activity has increased since the announcement of the FTB changes, affordability is still a key issue for FTB. This is particularly true in major cities, as wage growth falls behind HPI.
Fitch expects the increase in FTB to be temporary; low income growth, tighter underwriting and rising living costs will maintain pressure on affordability for FTB. As mortgage rates are currently low, any material rate rise will weigh further on mortgage affordability and serviceability.
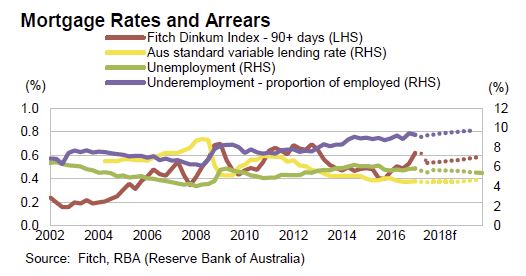
Mortgage Performance: Low Arrears to Continue
Mortgage arrears remained broadly stable in 1H17. This is despite lenders increasing mortgage rates, particularly for investment and interest-only loans, while the RBA has made no change to the cash rate. As at 3Q17, 30+ days arrears for prime RMBS were 1.02% according to our Dinkum RMBS index, compared with 1.09% at end-2016. The level of under-employment in Australia stabilised at 9.1% of employed persons in 3Q17 (9.2% in 3Q16), and this may be affecting the disposable income and servicing capacity for some borrowers.
Fitch expects mortgage performance to remain stable in 2018, as interest rates stay low. Fitch believes the adoption of APRA-prescribed serviceability practices by lenders in 2016 has improved borrower ability to service mortgage loans originated since then. However, the rising cost of living and sluggish wage growth are likely to increase pressure on recent borrowers who have little disposable income.
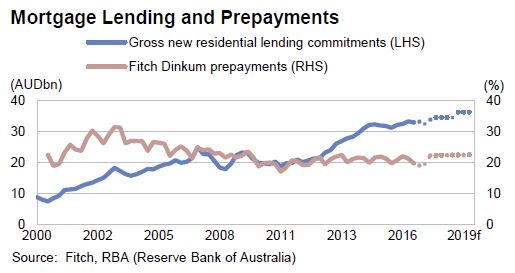
Mortgage Lending: Slower Growth. New mortgage lending growth has slowed in 2017 compared to end-2016, against a background of modest economic growth and reduced investment lending. Home sale transactions decreased in the year to October 2017 by 4.7% nationally (as per CoreLogic); combined capital city sales were 6.0% lower and combined regional market sales were down 2.2%. Lower investor demand, increasing transaction costs, higher capital requirements for banks, further prudential measures restricting lending to investors and stricter serviceability parameters, have restricted access to mortgages for some borrowers.
Fitch expects mortgage lending growth to slow to around 4% in 2018, based on continued record low interest rates and stable unemployment. This will once again be offset by continued underemployment, reduced investor demand and tougher lending practices.
Regulatory Environment: New Measures Introduced
In March 2017, the Australian Prudential Regulation Authority (APRA) announced additional supervisory measures to moderate investment lending in Australia. The APRA expects authorised deposit-taking institutions (ADI) to limit new interest-only lending to 30% of originations; limit growth in investment lending to 10% per year; ensure that serviceability metrics are set at “appropriate levels for current conditions”; and to continue to restrain lending growth in high-risk segments such as high loan-to-income loans, high LVR loans, and long tenure loans. The recently introduced measures relating to interest only lending have already been adopted by lenders and, along with the other restrictions brought in over the past two years, are reflected in the increased pricing of interest only and investment loans.
In July 2017, ownership restrictions were applied in New South Wales and Victoria; a 50% cap on foreign, non-resident ownership in new developments; a levy on foreign, non-resident investors whose properties are vacant for at least six months in a calendar year; increasing the capital gains tax (CGT) withholding rate to 12.5% from 10.0% and increasing the threshold for CGT to AUD2 million from AUD750,000. On 17 July 2017, the Treasury released draft legislation proposing that APRA extend its remit to regulate lending activities of non-ADIs.
Fitch expects the additional regulatory supervision measures to reduce the supply of lending to investors and moderate the house price growth in Sydney and Melbourne in 2018.
They say tighter mortgage regulation, record low rental yields, and increasing supply will slow Australian price growth. FTBs in Sydney and Melbourne received government support in 2017, but the impact is expected to be temporary, considering affordability pressure. Australia and New Zealand will post small rises in arrears as home prices in big cities stabilise.
Australia and the US have had nominal home price growth rates since 2010 of 41% and 32%, respectively, that have been substantially higher than rental growth rates. This has occurred despite a high rental growth of 19% in both countries over this period. Australia’s rental growth rate has flattened since 2016, while the rental growth for the US has been accelerating since then.
Australian housing completions have again been the highest of the countries covered. This has put downward pressure on prices in several cities and regions outside of Sydney and Melbourne, although immigration has kept the ratio per 1000 citizens more stable. In Sydney and Melbourne, much of the excess supply had been taken by non-residents, which will be dampened by limitations put in place in 2017.
Australia’s household debt as a proportion of GDP is now the highest across all tracked countries. It overtook the Danish household debt ratio, which has been deleveraging gradually since the peak of the housing market in 2009, helped last year by stable debt and an increase in GDP. Fitch’s mortgage market and macro outlooks are stable for Australia in 2018, but the high ratio increases reliance on a strong economy.
Here is their global summary.
“Arrears are at very low levels in most markets. They will only move in one direction as mortgage rates rise slowly due to higher policy rates and more expensive bank funding from the gradual unwinding of quantitative easing. Floating-rate loans and borrowers refinancing to new rates will be first affected,” said Suzanne Albers, Senior Director, Structured Finance, Fitch Ratings.
Long-term fixed-rate loans are less exposed to increasing rates, but fewer re-financings mean lower lending volumes, so lenders may face pressure to relax their origination standards, subject to regulatory limits.
Norway, Greece and the UK are the only countries not expected to see price rises this year, but Fitch notes that national trends can mask large performance variations within countries with some regions continuing to see unsustainable price rises while others stagnate or even fall.
“We expect home prices to stabilise in Sydney and Melbourne and show modest declines in Oslo, Toronto and London. However, if corrections are only limited after several years of very high growth, the risk of large price declines in future downturns remains,” added Ms. Albers.
Despite these challenges, six of the 22 housing markets covered by the report have seen upward revisions to their outlooks over the past 12 months compared with three being revised down, leaving just three, the UK, Canada and Norway, in Stable/Negative territory.
Fitch has a positive or stable/positive market outlook for seven of the nine eurozone countries in this report due to expectations for strong economic growth and continued quantitative easing (QE) in 2018. As the unwinding of QE and normalisation of interest rates is only expected in the medium-term, so the highlighted challenges are likely to materialise later than in other regions.
Fitch believes that in 2018 a combination of factors will be needed to constrain house price rises that have gone beyond market fundamentals and are primarily due to buyers’ expectations for further growth. Overheated markets slowed in 2017 when a combination of factors pressured prices, including lending limitations along with more local factors such as heightened supply and falling immigration in Oslo, multi-layered regulatory controls on home purchases and mortgage lending in China and for London, Brexit uncertainty plus the impact of buy-to-let (BTL) changes including lower tax deductibility of rental income.
Non-bank lenders (NBL) in the US, which tend to have more flexible credit standards, are six of the top 10 lenders by volume. In the UK, NBL have focussed on BTL lending where they have not yet been bound by stricter Prudential Regulation Authority guidelines that apply to deposit-taking institutions. NBL (especially government agencies) could also increase competition in Mexico as they move from index-linked lending to peso loans, the traditional market for banks.