In a week that was fairly light on data releases, let’s return to Australia’s perennial favourite topic – house prices. Painful though it may be for existing property owners who are selling, we are witnessing what a bubble slowly deflating back to reality looks like.
Data released Tuesday showed that across Australia’s eight capital cities prices fell 0.7% in the first quarter of 2017. Sydney was hardest hit, with prices down 1.2%. Melbourne and Brisbane experienced 0.6% declines and Perth prices were down 0.9%.
Price declines were more subdued over the previous 12 months, or were even still up over the period. Sydney prices were down 0.5% on the year, but Melbourne prices were still up strongly (6.2%) and Brisbane showed 1.6% annual growth. Perth, where prices have been under pressure for some time, registered a 1.5% fall over the last year.
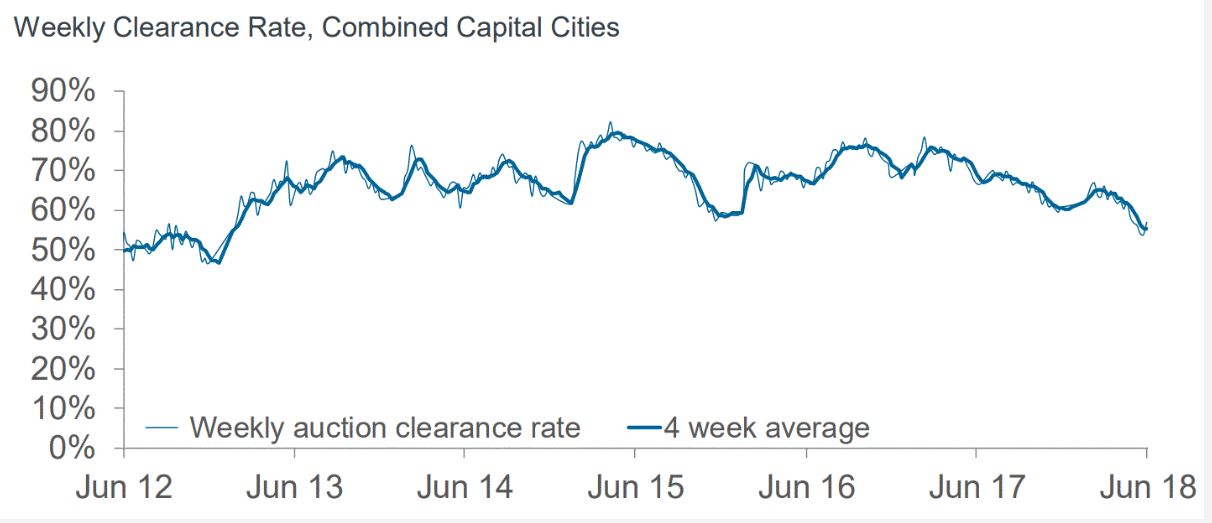
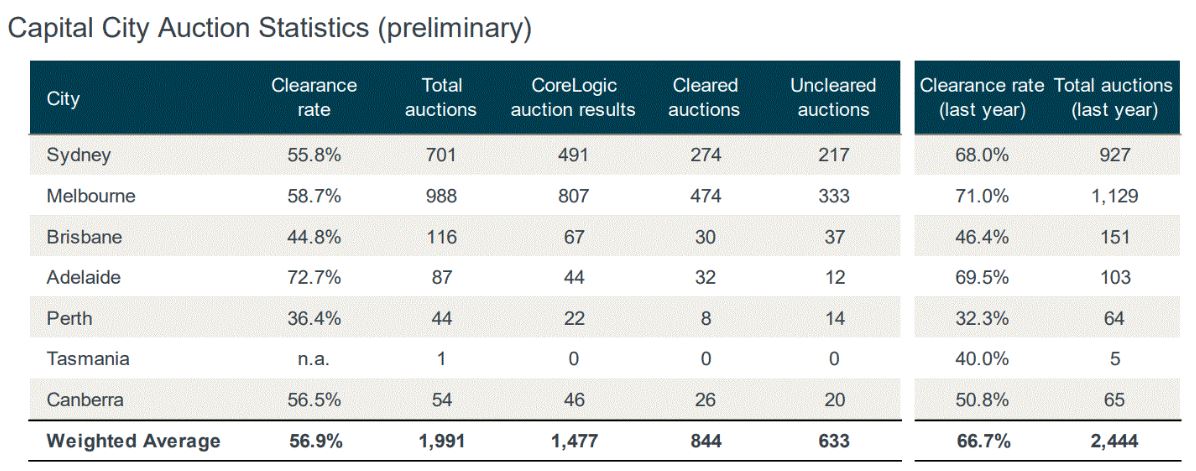
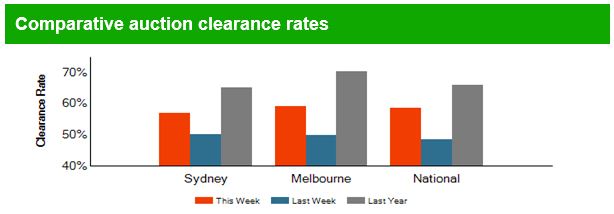
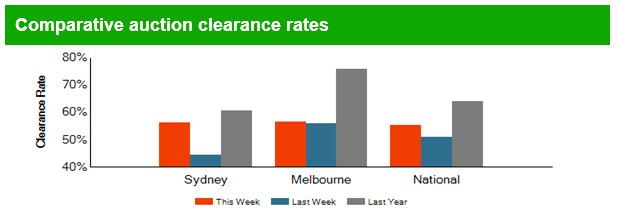
This downward price pressure is consistent with a reduction in auction clearance rates documented by CoreLogic. Last week, clearance rates averaged 56.9% across the country and just 55.8% in Sydney and 58.7% in Melbourne. Compare this to a year ago when the capital city average was 66.7%, Sydney was at 68.0% and Melbourne at 71.0%. And this doesn’t even factor in that auction volumes have dropped this year.
So here’s the deal. Fewer people are trying to sell their residential properties. Those that try are having less success in doing so. Those that do succeed are getting lower prices.
… housing prices were still 40% higher in Sydney and Melbourne than at the beginning of 2014, while housing prices in Perth had fallen by around 10% over the same period.
The big question is whether the housing market will continue to deflate slowly, or whether there is going to be an abrupt “pop”.
A big correction to property prices would require a major trigger. The most likely candidate for that trigger is interest-only loans.
The Australian Prudential Regulation Authority (APRA) stepped in last year, capping new interest-only loans at 30% of new loans. That, along with a tightening of underwriting standards by banks, has led to a sharp drop in such loans.
The RBA has been pushing an upbeat story about how this shakes out. As they tell it, the A$120 billion a year of interest-only loans coming due will be smoothly transitioned to principal-and-interest loans for most people.
Well, perhaps. I certainly hope so.
But for many people this transition will involve increases in monthly repayments of 30-40%. At a time when wages growth has been persistently sluggish, many people don’t have much wiggle room.
Interest-only loans typically have a five-year term and then need to be refinanced or become principal-and-interest loans. For a whole lot of folks, an interest-only rollover ain’t going to happen. Worse, the largest volumes of interest-only loans were written in 2013-2016.
So we are about to see a three-year wave of shifts to principal-and-interest loans.
Worse still, the loans originated in those years were heavily mediated by mortgage brokers whose incentives were all about moving volume, not quality. Widely cited research from investment bank UBS about the prevalence of so-called “liar loans” gives one every reason to be really worried about the ability of these borrowers to make a mortgage payment that has increased by a third or more per month.
And the rosy scenario the RBA keeps pushing involves look at the average buffer and embedded equity that households have. But that misses the economics 101 point that it is the marginal borrower that determines equilibrium prices, not the average.
If I’m selling hot dogs I don’t care what the average person is willing to pay for a hot dog, I care what the last person I might sell to is willing to pay, for she determines the price.
… about half of owner-occupier loans have prepayment balances of more than six months of scheduled payments. While that leaves half with only modest balances, some of those borrowers have relatively new loans.
It doesn’t matter than some of them are new borrowers – other than that they bought at the height of the bubble, making them more susceptible to financial stress than other borrowers. The fact is that a whole bunch of folks are on the wire. If their payments go up they are going to struggle to make them. And if a lot need to sell at once then, as they say at NASA, “Houston, we have a problem.”
The air may fizzle out of the Australian balloon, or it may burst violently. Either way we should be asking hard questions about why APRA waited so late to act on interest-only loans, liar loans and underwriting standards in general. Very hard, very public questions.
Author: Richard Holden, Professor of Economics and PLuS Alliance Fellow, UNSW
The NSW Government has failed to address stamp duty rates in yesterday’s budget, which haven’t been updated in 32 years.
Despite the housing affordability crisis being labeled as “the biggest issue” for people in NSW less than two years ago, there was little announced to address the issue at the state budget on Tuesday.
Soaring house prices in recent years saw a $4.3 billion housing affordability package put front and centre in last year’s budget.
This included measures to help out first-home buyers, such as abolishing stamp duty on properties under $650,000, and a number of other measures making it harder for investors and foreign buyers to purchase property.
Sydney house prices took their biggest hit since 2015 this year, with a 2.6 per cent drop over the last quarter.
And now that the housing market is cooling off, the NSW government appears to have halted new measures to improve housing affordability altogether.
“Over the past 12 months housing cooled more quickly than previously forecast,” Treasurer Dominic Perrottet said in his budget speech yesterday.
What the 2018 NSW budget means for property at a glance:
The First Home Owner Grant will more than double to $15,000 for first-time buyers of new property. From 2024, the grant will drop to $10,000.
The $7000 First Home Owner Grant will be abolished for existing properties.
First home buyers will continue to be exempt from stamp duty if buying new property. The threshold lifts from $600,000 to $650,000.
Non-first home buyers will be eligible for a $5000 grant if buying new property.
$481 million allocated to a Housing Acceleration Fund to build infrastructure in areas of housing growth in an effort to assist the supply of new housing.
Ten projects costing $181 million have already been identified in eight areas of housing growth, which will together support 76,000 new homes. These areas are: Camden/Liverpool, Blacktown, The Hills, Hornsby/Parramatta, City of Sydney, Wollongong, Wyong, Port Macquarie-Hastings.
REINSW CEO Tim McKibbin said the government collected $8.673 billion in stamp duty, $1billion less than 2016-17.
“The number of transactions has fallen and will continue to fall because people aren’t buying and selling real estate,” Mr. McKibbin said.
“The Budget forecasts $6 billion less than previously budgeted in stamp duty over the next four years but an increase by $407.6 million in land tax from stronger forecasts for land values,” Mr McKibbin said.
“Taxation is driving the market into the ground. It is fiscally naive, irresponsible and unconscionable not to reduce the stamp duty rates.
“There is empirical evidence that shows reducing taxation will increase the number of transactions and therefore it is a win – win. Government will get additional revenue and the consumer will get a more affordable product.
“The government can save a lot of time and money consulting the community on how to solve housing affordability – the answer to affordability is increasing supply and reducing property taxes,” he said.
CoreLogic’s preliminary results chime with those from Domain, in terms of trajectory, if not in absolute numbers.
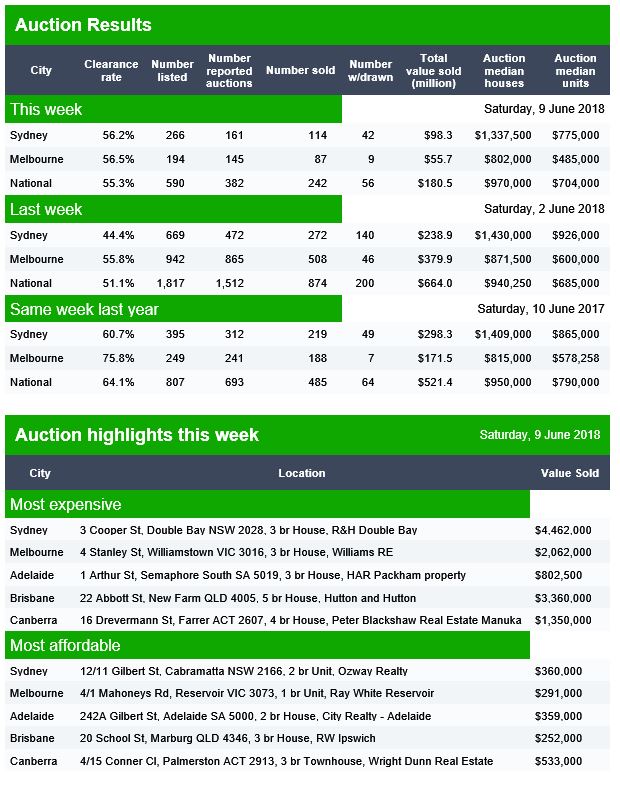
Auction volumes increased significantly over the week with 1,991 homes taken to auction across the combined capital cities, up from just 904 last week when auction volumes were lower due to the Queen’s Birthday long weekend.
The preliminary clearance rate was recorded at 56.9 per cent this week, after last week saw the final clearance rate revise down to just 53.8 per cent, the lowest level recorded across the combined capitals since 2012.
Melbourne was the busiest city for auctions this week, with 988 homes going under the hammer, returning a preliminary clearance rate of 58.7 per cent, compared to last week when 54.9 per cent of the 275 auctions were successful. Over the same week last year, there were 1,129 auctions held in Melbourne, returning a clearance rate of 71.0 per cent.
There were 701 auctions held in Sydney this week returning a preliminary auction clearance rate of 55.8 per cent. In comparison, last week there were just 415 auctions held and a final clearance rate of 56.0 per cent, while this time last year, 68.0 per cent of the 927 auctions held were successful.
Across the smaller auction markets, Brisbane was the busiest city with 116 homes going under the hammer, returning a preliminary clearance rate of 44.8 per cent. The highest preliminary clearance rate was recorded in Adelaide where 72.7 per cent of the 44 reported auctions were successful.
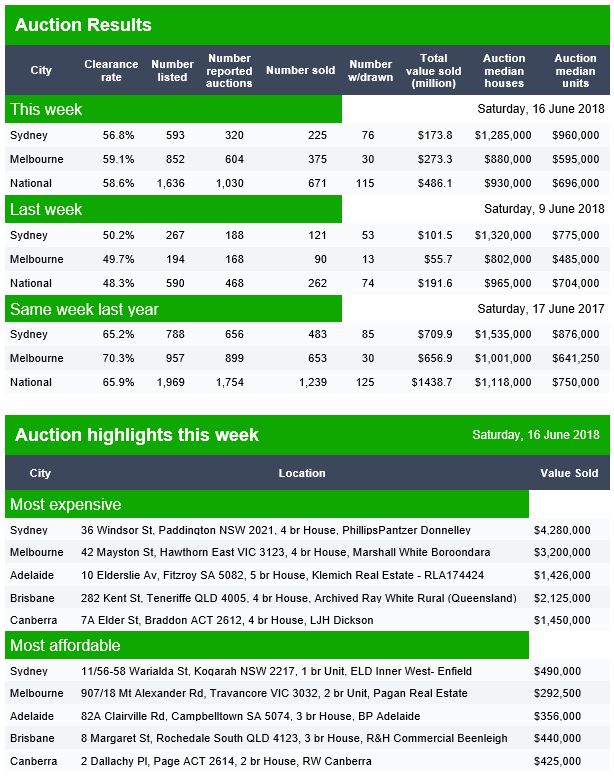
Today I want to look in more detail at the auction results over the past couple of years. I made a post recently which explained why we must take the auction clearance data from Domain and CoreLogic with a large pinch of salt, see “Auction Results Under The Microscope”. But that said, Doman’s latest data from yesterday’s auctions shows that volumes and values are well down. Anyone who wants evidence of how much the market has slowed, just compare the $1.4 billion each week a year ago, with $486 million today! The clearance rates will drop as more results come in, and it seems the volume of auctions initially listed compared with those that go head are significantly lower now.
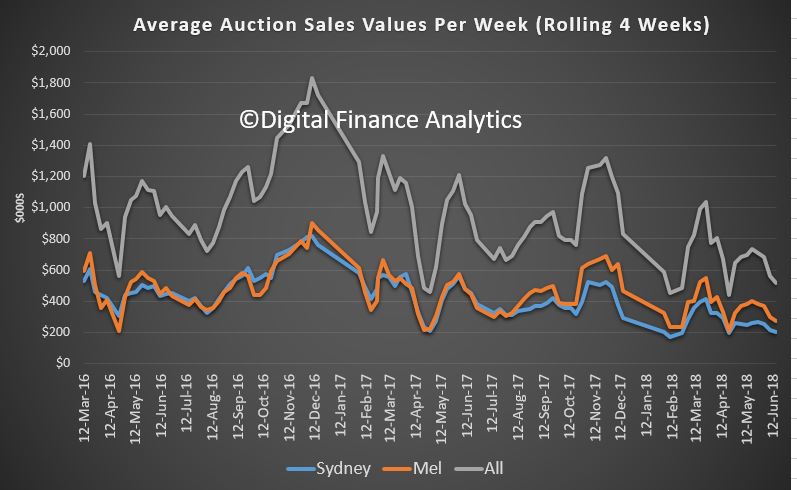
But I have been looking back over the past couple of years, with a focus in the total value of property sold each week at auction. I have used the Domain datasets for this analysis.
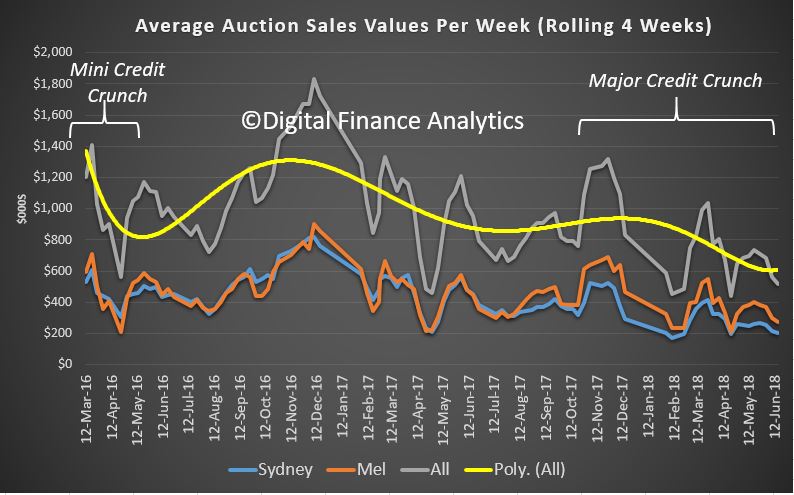
We can chart the rolling average over 4 weeks of property sold at auction by value. Sydney and Melbourne tracked each other until around July last year, but since then Melbourne has been running at a higher rate than Sydney. The total value cleared each week as been as high as $1.6 billion or so in 2016, to around $600 million now. But the trends are not necessarily that clear because of events such as holidays. [Note: scale is in $m not 000’s].
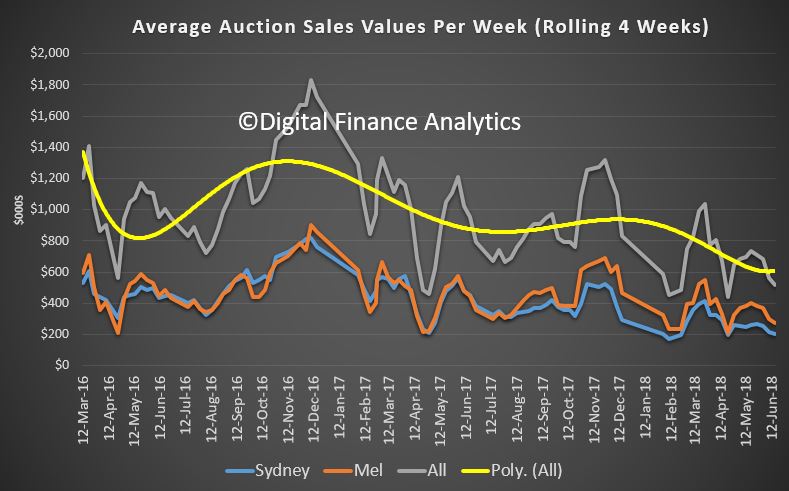
However, if you overlay a trend line, it is clear that the average value of sales closed at auction in 2016 are significantly higher than now.
There was an initial falloff in early 2016 as the 30% speed limit for investment mortgages started to bite, but this was actually relatively short in duration, and sales values picked up in later 2016 and into early 2017. But as the second round of credit tightening, including the focus on interest only lending and tighter underwriting standards; sales value momentum fell significantly through the latter half of 2017 and is dropping away further as we travel through 2018. While the 2016 tightening can be regarded as just a minor credit crunch, the one we are in now is a whole different ball-game – this is a major credit crunch and may become business as normal – and a very different normal too boot.
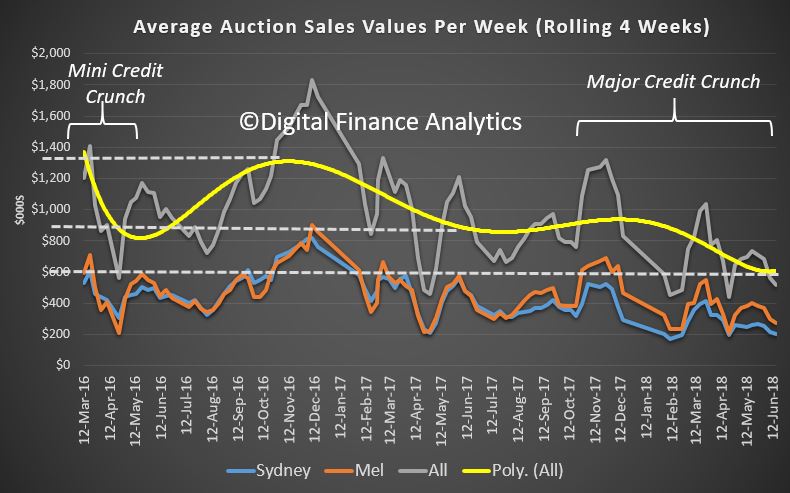
To underscore that, the average value cleared in November 2016 was around $1.35 billion a week. This time last year the average was a lower $900 million a week, and it is now sitting at around $600 million a week, and falling. We expect this week’s final results to be around $500 million. So sales values are one third down on a year ago, and more than 50% lower than 18 months ago. This is a significant correction.
This drop is explained by a smaller number of auctions, and also the fact that lower priced property is selling relative to the upper echelons of the market. We discussed this in yesterday’s Property Imperative weekly. But it is also explained, and correlated with the tightening in credit. As we have discussed before, credit availability is the primary driver of home prices. Less credit means less demand, and falling prices.
As we expect continued market tightening, as credit continues to be controlled more tightly, we should expect auction values and volumes to continue to languish.
More evidence that we are indeed entering a new phase of the housing market, with significant risks on the downside. It’s just a question of how quickly we slide.
Anyone who wants evidence of how much the market has slowed, compared the $1.4 billion a year ago, with $486 million today! The clearance rates will drop as more results come in, and it seems the volume of auctions which happen are significantly lower than those listed.
Brisbane reported 38 auctions from 88 listings, and 22 sold, at 52%. Adelaide listed 53, reported 26 and sold 22 at 76%. Canberra listed 50, reported 42 and sold 27 at 61% cleared.
Welcome to the Property Imperative weekly to 16th June 2018, our digest of the latest finance and property news with a distinctively Australian flavour.
Watch the video, listen to the podcast, or read the transcript.
We start with the international markets, because familiar market foes returned this week as the U.S. and China vowed to move ahead with trade tariffs. China ignored U.S. President Donald Trump’s threat of further tariffs in the event of retaliation, vowing to immediately impose penalties of the “same scale” on American goods, raising the prospect of a tit-for-tat trade war between the world’s two largest economies.
The Fed rate hike on Wednesday was accompanied by a more hawkish outlook on rate hikes. The U.S. central bank hinted at the prospect of two additional rate hikes this year, taking the expected total rate hikes for 2018 to four from three previously. The odds of a fourth rate hike at the Fed’s December meeting has soared to 51.1% from 33.8% the previous week. While the prospect of a faster pace of US monetary policy tightening also weighed on sentiment, that didn’t stop US stocks from notching a third-straight weekly win as a rally in tech and media stocks underpinned investor demand. The VIX volatility index, which signals the relative uncertainty in the market, was down again, from its peak a few weeks ago.
The U.S. District Court ruled in favour of the AT&T and Time Warner merger earlier this week, sparking a wave of action in media stocks and a day after the ruling, Comcast launched a $65 billion bid for Twenty-First Century Fox assets that Walt Disney had already struck a deal to buy, setting the stage for perhaps an intense bidding war. The S&P 500 posted a weekly win despite closing 0.25% lower Friday at 2,781.50 reacting to the escalating trade wars.
Crude oil prices settled sharply lower on Friday on concerns that OPEC would lift limits on production restrictions, paving the way for an uptick in global output, threatening the pace of rebalancing in oil markets. Investor fears that OPEC and its allies would hike output at its June 22 meeting came to the fore this week amid remarks from both Russia’s and Saudi Arabia’s Energy Ministers. Both agreed to gradually increase production. Crude futures settled 2.74% lower on Friday as data showed U.S. oil rigs continued to climb.
The US dollar closed at year-to-date highs against its rivals despite a modest setback on Friday, as a sharp tumble in the euro earlier this week encouraged traders to pile into the greenback. The euro suffered its worst daily loss in two years on Thursday after the European Central Bank said that it would leave interest rates unchanged until the summer of 2019, although they will taper down QE through this year. That came a day after the Federal Reserve had signalled a faster pace of rate hikes for this year and the next, further encouraging investor appetite for the greenback. The dollar fell 0.16% to 94.79 against a basket of major currencies on Friday. The Aussie Dollar slipped against the US Dollar, which signals a risk of importing inflation into Australia and risks to the local economy.
Gold prices fell to 2018 lows on Friday as traders appeared to unwind their holdings of gold despite the growing prospect of a trade war between the U.S. and China. That, however, failed to lift demand for safe-haven gold amid expectations the dollar will continue its upside momentum.
And crypto currencies slid this week, wiping more than $60 billion from the market, as bitcoin fell to a near four-month low before staging a timid rebound. Bitcoin started the week on the back foot after South Korean crypto exchange Coinrail confirmed in a tweet that cyber thieves had made off with over $30 million worth of lesser-known cryptocurrencies following a successful cyberattack. That proved to be touch paper for further selloffs as the popular crypto fell close to a four-month low of $6,125.7, rattling traders’ appetite to hold cryptos as billions of dollars were pulled from the market.
The total crypto market cap fell to about $282 billion, from about $342 billion a week ago. Over the past seven days, Bitcoin fell 18.67%, Ethereum fell 14.04%, while Ripple XRP fell 19.29%. More evidence, if you needed it that crypto is not a stable currency alternative.
But risks lurk in the dark corners, according to Fitch Ratings. Global trade tensions have risen significantly this year, but at this stage they say the scale of tariffs imposed remains too small to materially affect the global growth outlook. A major escalation that entailed blanket across-the-board geographical tariffs on all trade flows between several major countries would be much more damaging.
In addition, populist political forces continue to create policy risk and increase the threat of rising tensions within the eurozone that could adversely affect the outlook for investment, a key driver of growth last year. Fitch made only a modest downward revision to their eurozone investment forecast for this year (to 3.3% from 3.9% in March), but a further escalation in uncertainty represents an important downside risk.
And a much sharper-than-anticipated pick-up in US inflation remains a key risk to the global outlook they said. The decline in US unemployment – to 3.8% in May – is becoming more important to watch, and they forecast the rate to hit a 66-year low of 3.4% in 2019. A wide array of indicators of US labour market tightness suggest it is now only a matter of time before sharper upward pressures on US wage growth start to be seen. They said that “An inflation shock in the US could bring forward adjustments in US and global bond yields and sharply increase volatility, harming risk appetite. In particular, it could lead to a rapid decompression of the term premium, which remains negative for US 10-year bond yields. In combination with a likely aggressive Fed response, this would be disruptive for global growth.
Indeed, the synchronised global economic growth that began in 2018 appears to be running its course, according to NAB. ‘Synchronised global growth’ was a favoured expression by economists and research houses at the end of last year, with each of the 45 major economies tracking upward growth.
But according to the latest economic summary by NAB this global growth rate may have reached its peak. Growth in the major economies was 2.2 per cent year-on-year in the first quarter of 2018, a small drop from the 2.4 per cent growth in the last quarter of 2017. “Although this slowdown was modest, it points to a divergence in conditions across countries, which over recent years have displayed relatively synchronised growth.” In addition, many short- and long-term interest rates have started to increase, or will do so over the forecast period”.
Turning to the local scene, Moody’s confirmed Australia’s rating of Aaa, which puts us in an exclusive club alongside United States, Switzerland, Sweden, Norway, Denmark, Netherlands and New Zealand. They just reviewed the rating (some other agencies still have a negative watch on Australia, as they are more concerned about the outlook, given our exposure to foreign trade and debt) but Moody’s concluded that thanks to good GDP numbers, relatively low (on an international basis) Government debt – at only 42% of GDP, though up from 26.5% five years ago and our strong institutions (RBA and APRA), the rating is confirmed. The bonus income from higher resources prices also helped. They did highlight some concerns about the Government needing to control spending in order to bring the budget back into balance as forecast, against a fraught political background and also the risks from high levels of household debt in a flat wage environment. They suggest that household income growth will be lower than government forecasts, but they are still looking for GDP growth around 2.75%. They also suggest that Government spending will remain under pressure given the expected 6% rise in social welfare programmes including health and NDIS. In terms of risks, they see two, first is rising household debt, which they say exposes the economy and government finances. Second is Australia’s reliance on overseas funding, which may be impacted by changes in international investor sentiment. Rate rises abroad might lift the cost of government and bank borrowing, adding extra pressure on the economy. But their judgement is these risks are not sufficient to dent the prized Aaa rating. So that’s OK then, except that…
S&P Global Ratings RMBS Performance Watch to 31st March 2018 said that the prime 30-day SPIN was 1.37% in Q1 2018, up from 1.07% the previous quarter. They say that loans more than 90 days in arrears were at a historically high level at the end of Q1, indicating that mortgage stress has increased for some borrowers. Western Australia meanwhile again recorded the nation’s highest arrears, at 2.71%. Arrears rose during Q1 in most parts of the country. And they warned of the consequences of higher interest rates ahead. You can grab our separate post “What the Rating Agencies Are Saying” for more details.
Our latest Household Financial Security Index showed a further fall dropping to 90.2, down from 91.7 last month. This is below the neutral setting of 100. Property-related sentiment is hitting hard, especially in New South Wales and Victoria where price falls are most evident. Younger households the budget pressure on them remains severe, especially those paying rent, or mortgages. Those entering the retirement phase, 60+ continue to wrestle with outstanding mortgages (many hold these loans into retirement now) and also lower returns from deposits. You can get the full results in our post “Household Financial Security Tanks In May, As Property Falls Hit Home”.
It’s worth putting this alongside the RBA comments this week on wages growth, which suggests that any lift from the current anaemic levels will be slow. And real debt burdens will stay higher for longer in this scenario. Many people who borrowed expected their incomes to grow at something like the old rate rather than the current rate. With their expectations not being realised, the real value of the debt stays higher than they expected and this is likely to affect their spending decisions. And beyond these purely economic effects, the slow wages growth is diminishing our sense of shared prosperity. If this remains the case, it can make needed economic reforms more difficult.
Oh, and the employment data out this week superficially looked OK, with an increase in the total number of jobs, and a fall in the seasonally adjusted rate of employment from 5.6% last month to 5.4% in May. But in fact we think this is another soft result, thanks to a slide in the number of hours worked, anaemic and falling jobs growth, a further shift to part time employment, and a rise in underemployment. The monthly trend unemployment rate remained steady at 5.5 per cent, well above the 5% level at which wage rises may kick in according to the bank. See more at our post “Unemployment Signals More Trouble Ahead”. The trend participation rate decreased by less than 0.1 per cent to 65.5 per cent in May 2018.
The auction results last week were down again but hardly worth a mention, given the long weekend in many states. But the trend of slowing property continues to bite harder. CoreLogic once again have been looking at where prices are falling. They say that across the combined capital cities, dwelling values have fallen 1.1% over the past 12 months. Looking at the 1st decile, values have increased by 1.3% over the past year while across the 10th decile values have fallen by -5.7%. Of note is that when values fall, declines across the most affordable properties have been significantly smaller than the declines across the most expensive properties. The opposite is generally the case during the growth phase, where the most expensive properties have generally outperformed the broader market.
Sydney has seen the largest declines of all capital cities over the past year with values -4.2% lower. Across the 1st decile, values are 1.0% higher while the 10th decile has recorded value falls of 7.3%. Over the past year, Melbourne dwelling values have increased by 2.2% with the 1st decile recording an increase of 10.3% while the 10th decile has seen value fall -3.5%.
This makes it clear that you need to get granular across the property market, something which we discussed in our interview with Buyers Agent Chris Curtis, last week. The full interview “Property Dispatches from The Front Line” is still available and I recommend it. This post hit top spot on both our blog and YouTube sites. It seems that first time buyers are helping to support the market, though the latest figures show that total number of first time buyer loans in May fell by 8%.
Indeed, overall lending growth is slowing as the ABS data this week showed. They confirm the macro trends we already reported. Lending volume flows are solidly down, and the trends suggest more in the months ahead. We are entering a new phase in the credit cycle, and this will put further pressure on home prices. You can get more from our post “Yet More Evidence Of The Property Slowdown”
Finally, as the AFR pointed out, the banks are under intense margin pressure now as they are being squeezed by higher borrowing costs as the US Federal Reserve accelerates its interest rate hikes and drains liquidity from global financial markets while the Hayne royal commission makes it difficult for them to raise home loan rates. They said that analysts estimated that the spreads paid by Australian banks have climbed by close to 40 basis points since the beginning of the year, which has swollen the wholesale borrowing costs of the country’s banks by some $4.4 billion a year. They quoted AMP’s head of investment strategy, Shane Oliver, who said the blowout in the BBSW could reflect Australian borrowers rushing to lock in funding before the end of the financial year, for fear that the borrowing situation could worsen. Dr Oliver said the banks were likely to be absorbing the higher funding costs in their margins. But, he warned, the “risk is that they will start to increase some mortgage rates”.
But we think something else is going on, because the spreads in Australia are a lot bigger now than other markets, and we suspect it’s a lack of confidence in our local banks, thanks to the revelations from the Royal Commission. A quick look at the recent share prices of for example Westpac, the largest investment loan lender, and CBA the largest owner occupied loan lender tells the story. The markets are nervous. The pincer movements of higher funding, less confidence and a slowing and more risky housing market are all adding to the banks’ woes. They are stuck because any lift in mortgage rates will drive prices lower and lift defaults from overleveraged households. Actually this is the reason why we think the RBA may be forced to cut the cash rate ahead. A nasty cocktail.
But as cities like Berlin and Barcelona have learned, regulating these platforms is not always easy. Enforcing restrictions against individual hosts can be costly. Airbnb has also challenged regulations limiting short-term letting.
At the same time, there has been a lot of hype about platforms like Airbnb as leaders of a new “sharing economy”. This has made some governments wary of interfering with a potentially lucrative economic driver.
How do you tell if it’s sharing or business?
To ensure these new platforms are regulated effectively, it’s important that we understand exactly what they do, and the impacts they’ve having. Despite Airbnb’s efforts to promote itself as being all about sharing, there’s actually a mix of activities happening on its platform. In a new research paper, we examined these different activities, to better identify how Airbnb is being used and whether the platform should be viewed as a “sharing economy” superstar.
Overall, we found that in late 2016, about a quarter of Sydney’s Airbnb listings were best viewed as short-term letting businesses, rather than examples of the sharing economy in action. The figure was greater for other global cities we looked at – 26% in New York, 28% in London and Hong Kong, and a hefty 49% in Paris.
So how did we reach this conclusion? To start, we needed a definition of the “sharing economy”. We took this to mean economic activity involving the sharing of excess capacity in an asset or service, which is driven by a sharing attitude.
We then took a close look at listing data from the five cities and identified two categories of use:
House sharing, which includes advertising part of a house (a private or shared room) or a whole house for a small portion of the year (up to 90 days). These uses suggest that the property is otherwise meeting someone’s permanent housing needs.
Traditional short-term lets, meaning properties permanently offered for short-term rental, thus preventing their use as long-term housing. This includes properties available or booked for more than 90 days per year, and those where the host has multiple listings.
By categorising listings this way, we get a clearer sense of whether Airbnb is really being used to share spare housing capacity, or to run commercial rental accommodation.
Unfortunately, Airbnb keeps tight control over data about the use of its platform. This makes it challenging to quantify these uses.
To get around this, a few organisations have scraped and collated data from Airbnb’s website. While much existing research uses a dataset from Inside Airbnb, our research complements this work by using a dataset produced by the company AirDNA. While neither dataset is perfect, together they provide an increasingly clear picture of Airbnb’s impact.
What did our research find?
Our findings show a significant share of Airbnb hosts are using the platform to engage in economic activity that existed long before Airbnb did – that is, dwellings are used as serviced apartments, B&Bs or holiday rentals. This is commercial activity, not sharing. These properties aren’t just “excess” unused housing space and there’s no “sharing attitude” involved.
While commercial properties are not the majority of listings, other research suggests that this activity nonetheless generates a larger proportion of Airbnb’s income than home-share activity. In many cities this activity is also already subject to planning laws and land-use regulations about “tourist accommodation”. This means these Airbnb listings are potentially in breach of existing laws.
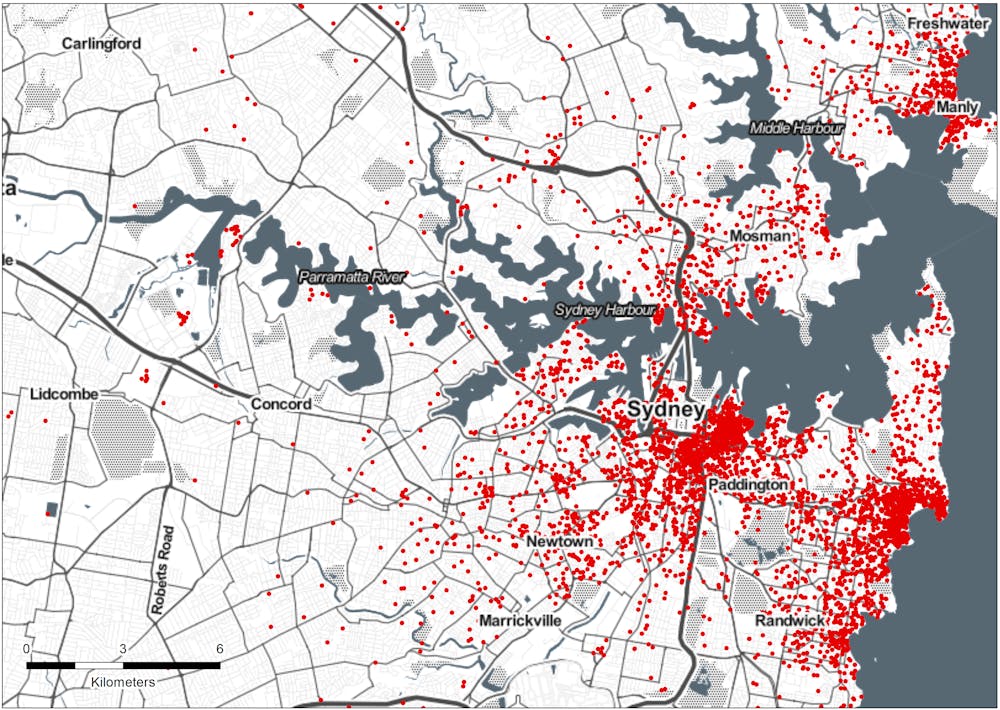
Furthermore, by mapping the Sydney listings we can see that while these traditional short-term lets were only about a quarter of listings, they were overwhelmingly concentrated in suburbs with very tight rental markets.
LOCATION OF TRADITIONAL SHORT-TERM LETTING
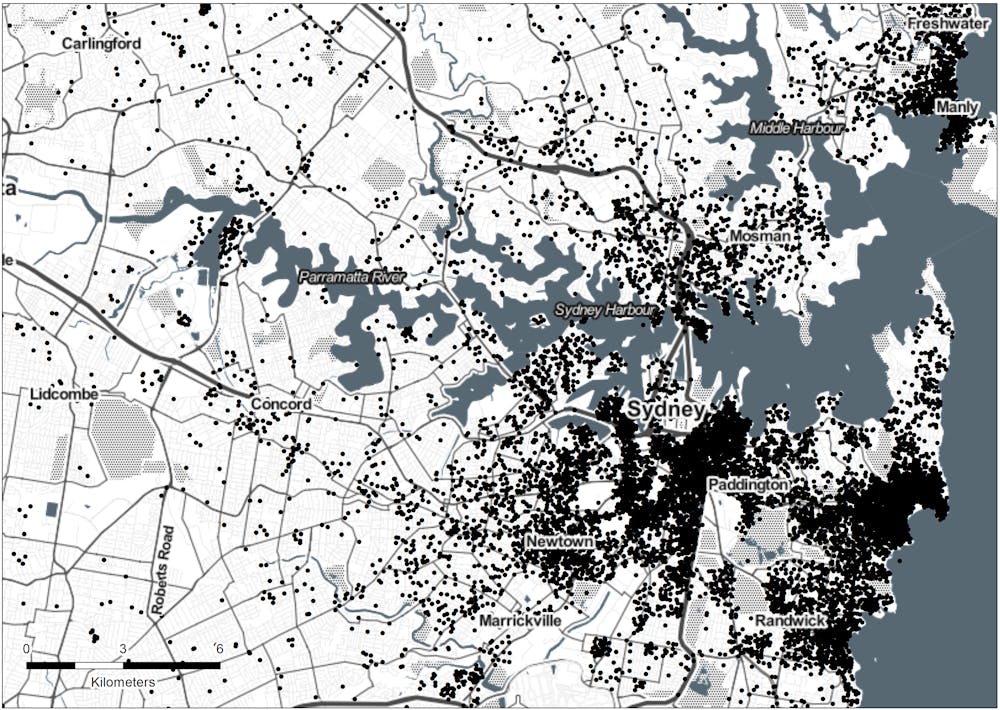
LOCATION OF HOUSE SHARING
Another factor is the rapid growth of Airbnb since late 2016. Australia now has 87% more listings than in late 2016. That’s a lot of properties in popular neighbourhoods that might otherwise be long-term rentals. So not only is this commercial activity not “sharing” at all, it’s also potentially pushing renters into shared living elsewhere, by reducing the amount of available rentals.
What does this mean for regulation?
So where does this leave our regulators? In our view, any policy decision needs to account for the different uses of these platforms, and be particularly focused on the impact of commercial short-term letting. While house sharing also raises concerns – particularly in apartment complexes – it at least fits the “sharing economy” model and arguably provides some of the shared financial, social and environmental benefits sharing economy supporters claim.
At the same time, regulators need to act on the lack of transparency in debates about platforms like Airbnb. Without good data, it will be tough for regulators to target their efforts at the most problematic aspects of new technologies. As we conclude in our research paper:
If Airbnb is genuinely committed to the ideal of ‘sharing’, as it regularly claims, it should share its data with regulators, even if it is not made publicly available. Airbnb’s unwillingness to do so (to date) indicates its sharing rhetoric is more of a sales pitch than a guiding philosophy.
Authors: Laura Crommelin, Research Lecturer, City Futures Research Centre, UNSW; Chris Martin, Research Fellow, City Housing, UNSW; Laurence Troy, Research Fellow, City Futures Research Centre, UNSW