The Property Imperative Weekly – 21 April 2018

The finance sector unmentionable hits the proverbial fan. Welcome to the Property Imperative Weekly to 21st April 2018.

We start this week’s review of the latest finance and property news with the latest from the Royal Commission into Financial Services Misconduct.

After the shameful disclosures relating to poor lending practices, bad advice, misaligned incentives and poor regulation last time; now they have been looking to the nether regions of financial planning and advice.  And guess what, the same behaviours are evident again, in spades.  Bearing in mind 48% of the $4.6 billion annual revenue from wealth management goes to the big four banks and AMP, they were forced to admit their mistakes in public. You can watch our separate video on the detailed findings “More Cultural Badness from The Finance Sector”. But here are a few highlights.

AMP apologised unreservedly for the misconduct and failures in regulatory disclosures in the advice business as revealed in the Royal Commission and Chief Executive Officer, Craig Meller will step down from his role with immediate effect.

The Australian Bankers Association admitted that the issues raised have been unacceptable and do not meet the high standards the community rightly expects of banks. And the Treasurer announced significant increases in penalties ASIC can impose.      The government will increase penalties under the Corporations Act to: “For individuals: 10 years’ imprisonment; and/or the larger of $945,000 OR three times the benefits; For corporations: the larger of $9.45 million OR three times benefits OR 10% of annual turnover.  “The Government will expand the range of contraventions subject to civil penalties, and also increase the maximum civil penalty amounts that can be imposed by courts, to the maximum of: the greater of $1.05 million (for individuals, from $200,000) and $10.5 million (for corporations, from $1 million); or three times the benefit gained or loss avoided; or 10% of the annual turnover (for corporations). “In addition, ASIC will be able to seek additional remedies to strip wrongdoers of profits illegally obtained, or losses avoided from contraventions resulting in civil penalty proceedings.”

These increases are right, as before the financial impact of poor behaviour was very low. However, do not be misled, changing penalties will not address the fundamental cultural, structural and economic issues which have combined to deliver a finance sector which is simply not fit for purpose.

We need to remove incentives from the advice sector (mortgage brokers included). Actually we need unified regulation across credit and wealth sectors (the current two regimes are an accident of history).

We need structural separate and disaggregation of our financial conglomerates. We need a realignment of interests to focus on the customer – which by the way is not at odds with shareholder returns, as customer focus builds franchise value and returns in the long term.

We need cultural reform and new values from our finance sector leaders. And Executive Pay should come under the spot light.

We need a reform of the regulatory structure in Australia, because they are captured at the moment at least by group think, and their interests are aligned too closely to the finance sector. This must include ASIC, APRA, RBA and ACCC. All have bits of the finance puzzle, but no one is seriously accountable.

But there is a more fundamental issue. We have relied on overblown credit, and superannuation sectors, as a proxy for high quality economic growth. This inflated housing and lifted household debt and GDP. We need a fundamental economic reset, because reforming financial services alone won’t solve our underlying issues.

The Government, who resisted the Royal Commission, has now also indicated they are receptive to expanding the scope and term of the inquiry, which in my view should include regulation of the sector, and the macroprudential settings in place.  So write to the Commissioner, and your MP advocating a broader scope.

Finally, on this, it is worth noting that former deputy prime minister Barnaby Joyce went with a full-monty confession. “In the past I argued against a Royal Commission into banking. I was wrong. What I have heard … so far is beyond disturbing”, he tweeted. Joyce is now a backbencher, and free with his opinions. It’s another story with current ministers. They continue trying to score political points over Labor, which had been agitating for a royal commission long before it was set up.

My suggestion is this financial sector mess is so significant, that both sides of politics should set aside party differences and focus on the main game. Because what happens next will fundamentally determine the future economic success of the country, no less.  If we continue with the current sets of assumptions we will run the country into the ground as the debt burden becomes unbearable, and savings for retirement are devalued and destroyed. It’s that serious.

Turning now to more immediate economic news, the latest lending stats from the ABS underscores that the “Great Credit Binge Is Ending”. You can watch our recent video where we discuss the results in full.  To start at the end of the story, we see significant falls across most states in investment lending flows, with the most significant falls in the Sydney market. The share of investment flows continues to drift lower, to around 35%. But that is still substantial investment lending! Finally, the percentage of investment lending of all lending flows is below 20%, and shows a small fall. But we also see a fall in business lending to around 55%, excluding investment property lending.

The ABS also released their March 2018 unemployment statistics. It was not good with the trend unemployment rate increasing slightly to 5.6 per cent though the trend participation rate increased to a record high of 65.7 per cent. WA has the highest rate of unemployment at 6.4% and is still rising, whilst rates in NSW and ACT also rose.

The HIA released their latest Housing Affordability report, claiming that affordability improved in most of Australia’s capital cities during the first three months of 2018 as house price pressures eased. But this is largely spin, as their calculations do not necessarily take account of the now tighter, and becoming even tighter lending standards now in play.  And in any case, in most centres, affordability is still well below the long term averages. But of course, they are advocates for the property sector, so there should be no surprise.

There was important evidence of the rising costs of funds this week as ME Bank says it has lifted its standard variable rate on existing owner-occupier principal and interest mortgages, effective April 2018. ME’s standard variable rate for existing owner-occupier principal-and-interest borrowers with an LVR of 80% or less, will increase by 6 basis points to 5.09% p.a. Variable rates for existing investor principal-and-interest borrowers will increase by 11 basis points, while rates for existing interest-only borrowers will increase by 16 basis points. ME CEO Mr Jamie McPhee said the changes are in response to increasing funding costs and increased compliance costs. More hikes will follow, across the industry together with reductions in rates paid on deposits as the fallout of the Royal Commission and higher international funding costs take their toll.

For example, the 10-year US Bond rate is moving higher again, following some slight fall earlier in April. Have no doubt, funding cost pressure will continue to rise. We discussed the whole question of debt and the potential trigger for a recession in a recent video blog, “Global Debt and the Upcoming Recession”.  The outlook looks more and more like our Armageddon scenario, as we discussed in detail in an earlier programme “Four Scenarios (None Good)”.  Worse, regulators in the USA and China are both weakening banking regulation, at this time of high risk, high debt.

Oh, and by the way, we think it quite possible the RBA will need to do its own form of quantitative easing down the track, and that they will most likely buy pools of residential mortgages (yes including those with breached lending standards) to assist the banks in their liquidity, to assist home prices to rise, and allowing the debt bomb to tick for longer.  Sound of can being kicked firmly down the road! But that would be the time to buy Australian equities, and even property.  Maybe we need a scenario 5!

We released the latest Digital Finance Analytics Household Finance Confidence Index for March 2018 shows a further slide in confidence compared with the previous month. The current score is 92.3, down from 94. 6 in February, and it has continued to drop since October 2016. The trend is firmly lower and below the neutral setting. You can watch our separate video on this “Why Household Finance Confidence Fell Again”.  But in summary, across the states, confidence is continuing to fall in NSW and VIC, was little changes in SA and QLD, but rose in WA. There were there were falls in all age groups. Turning to the property-based segmentation, owner occupied householders remain the most confident, while property investors continue to become more concerned about the market. Those who are property inactive – renting, or living with parents or friends remain the least confident. Nevertheless, those who are property owners remain more confident relative to property inactive households. Based on the latest results, we see little on the horizon to suggest that household financial confidence will improve. We expect wages growth to remain contained, and home prices to slide, while costs of living pressures continue to grow. There will also be more pressure on mortgage interest rates as funding costs rise, and lower rates on deposits as banks trim these rates to protect their net margins.

Finally, we turn to CoreLogics’s auctions data. They suggest that fewer auctions will take place this week, with a total of 1,592 properties scheduled, compared with last week’s final result of1,915 auctions held. This is also lower than a year ago when 1,751 auctions were held across the capital city markets. Sydney is set to see the most significant drop in activity this week. Victoria’s Reservoir and Surfers Paradise in Queensland both top the busiest suburb list this week, each with 19 properties scheduled to go to auction.  Following with 14 scheduled auctions each is Burwood and Point Cook both in Victoria.

Turning to last week’s final results the clearance rate was a 61.7 per cent success rate which was lower than the week prior when 62.8 per cent. Melbourne’s final auction clearance rate fell to 62.4 per cent last week across a slightly higher volume of auctions week-on-week with 873 held, up on the 723 over the week prior when a higher 68.2 per cent cleared.  In Sydney, the final clearance rate fell to 61.5 per cent, down on the 62.9 per cent the previous week, with volumes across the city remaining steady over the week with a total of 795 held. Clearance rates improved across all of the remaining auction markets last week, with the exception Tasmania which remained unchanged. Geelong recorded the highest clearance rate of the non-capital city regions, with 77.1 per cent of 54 auctions clearing.

You might want to watch my video on “Auction Results Under The Microscope”, where we discuss how the results are collated and whether we can trust them.

So overall, there is little evidence to suggest the property market is recovering (despite more from the Industry claiming that this was the case, this week). And we have yet to see the impact of tighter lending standards flowing through. Our survey data indicates that more households are finding it tougher to meet the income and expenditure hurdles now, and as a result we expect credit and therefore home prices to continue to fall. And if anything, that fall will likely accelerate, unless we get unusual measures in the budget, which by the way we think are quite likely.


The Property Imperative Weekly to 14 April 2018

Welcome to the Property Imperative Weekly to 14 April 2018. We review the latest property and finance news.

There is a massive amount to cover in this week’s review of property and finance news, so we will dive straight in.

CoreLogic says that final auction results for last week showed that 1,839 residential homes were taken to auction with a 62.8 per cent final auction clearance rate, down from 64.8 per cent over the previous week. Auction volumes rose across Melbourne with 723 auctions held and 68.2 per cent selling. There were a total of 795 Sydney auctions last week, but the higher volumes saw the final clearance rate weaken with 62.9 per cent of auctions successful, down on the 67.9 per cent the week prior. All of the remaining auction markets saw a rise in activity last week; clearance rates however returned varied results week-on-week, with Adelaide Brisbane and Perth showing an improvement across the higher volumes while Canberra and Tasmania both recorded lower clearance rates. Across the non-capital city regions, the highest clearance rate was recorded across the Hunter region, with 72.5 per cent of the 45 auctions successful.

This week, CoreLogic is currently tracking 1,690 capital city auctions and as usual, Melbourne and Sydney are the two busiest capital city auction markets, with 795 and 678 homes scheduled to go to auction. Auction activity is expected to be lower week-on week across each of the smaller auction markets

Two points to make. First is a slowing market, more homes will be sold privately, rather than via auctions, and this is clearly happening now, and second, we discussed in detail the vagaries of the auction clearance reporting in our separate blog, so check that out if you want to understand more about how reliable these figures are.

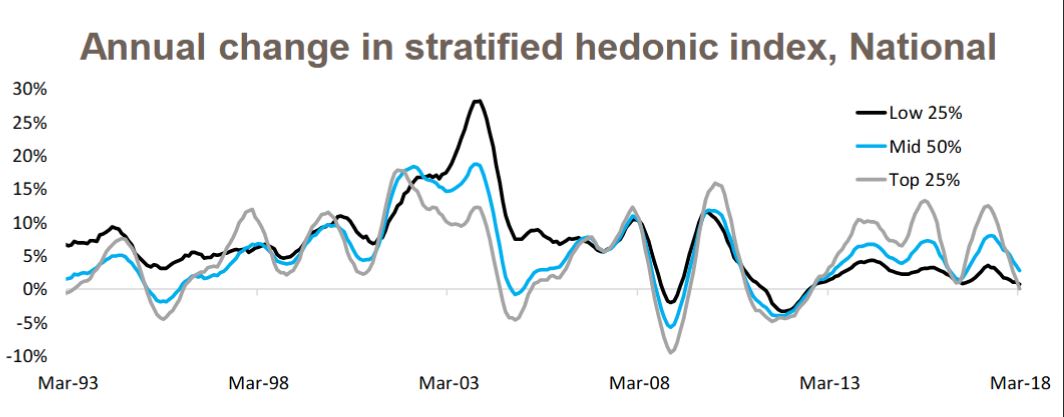
Home prices slipped a little this past week according to the CoreLogic index, but their analysis also confirmed what we are seeing, namely that more expensive properties are falling the most. In fact, values in the most expensive 25% of the property market are falling the fastest, whereas values for the most affordable 25% have actually risen in value.

Their analysis shows that over the March 2018 quarter, national data shows that dwelling values were down by 0.5%, however digging below the surface reveals the modest fall in values was confined to the most expensive quarter of the market. The most affordable properties increased in value by +0.7% compared to a +0.3% increase across the middle market and a -1.1% decline across the most expensive properties.

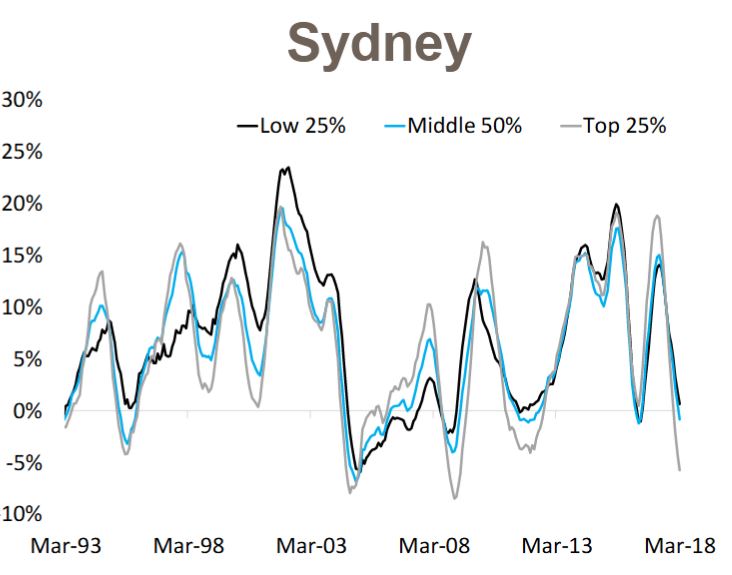
But looking at the details by location, in Sydney, over the past 12 months, the most expensive properties have recorded the largest value falls (-5.7%) followed by the middle market (-0.9%) and the most affordable market managed some moderate growth (+0.6%).


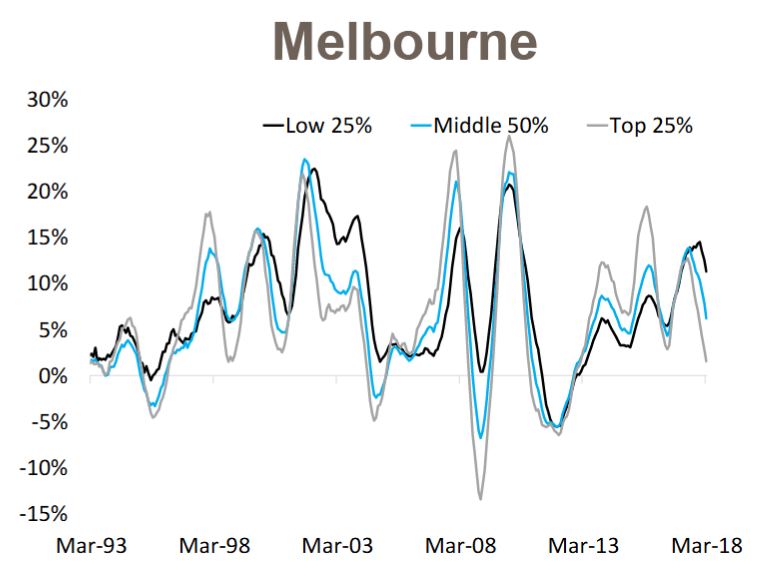
Compare that with Melbourne where values have increased over the past year across each segment of the market, with the most moderate increases recorded across the most expensive segment (+1.6%), then the middle 50% (+6.2%) while the most affordable suburbs have recorded double-digit growth (+11.3%)

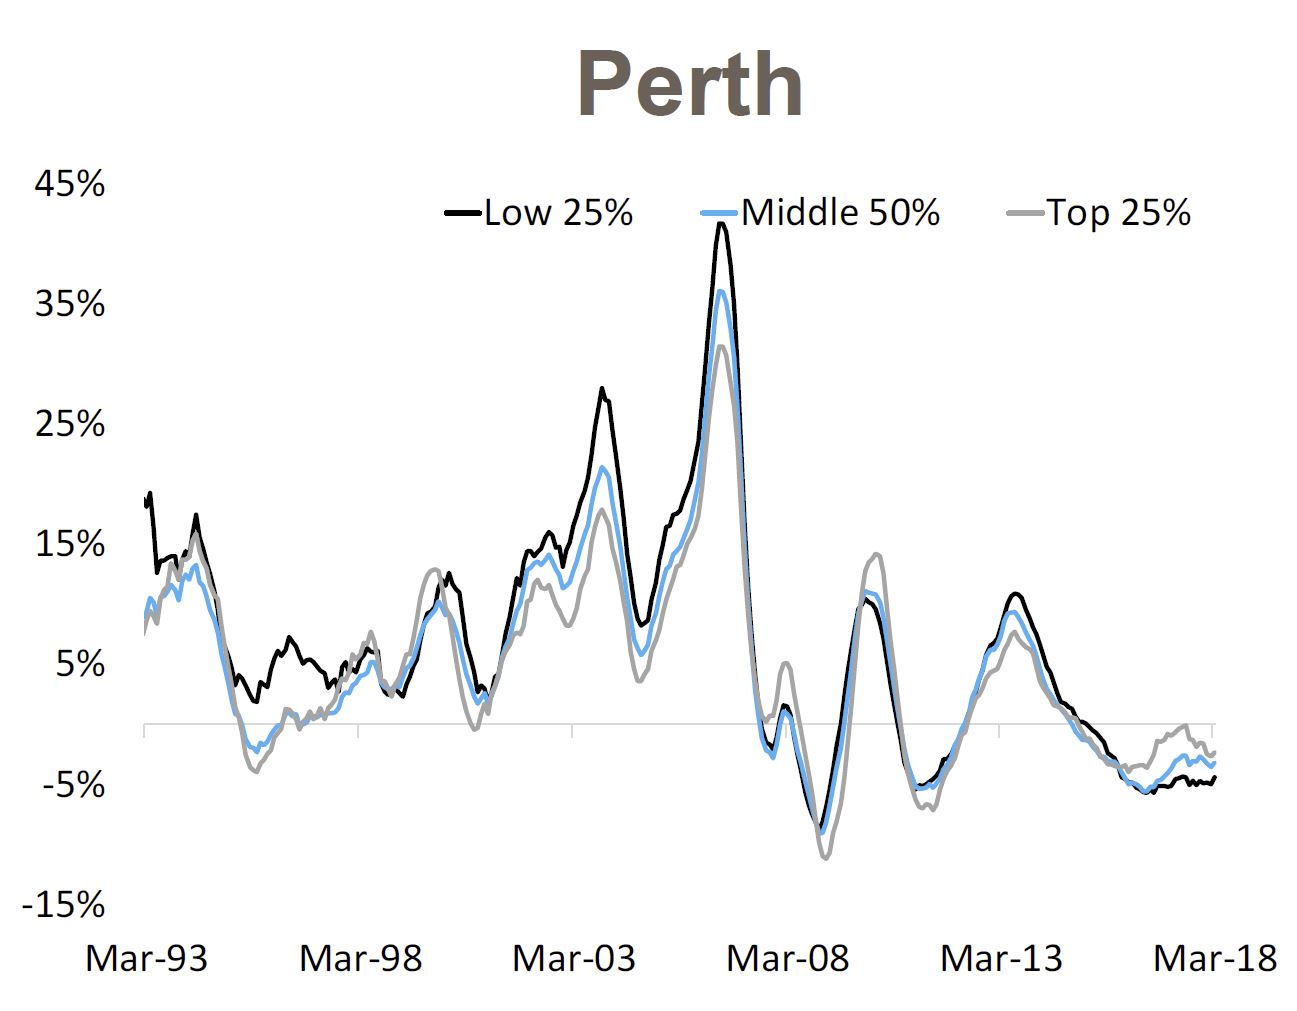
Finally, in Perth values have fallen over the past year across each market sector with the largest declines across the most affordable properties (-4.4%) followed by the middle market (-3.2%) with the most expensive properties recording the most moderate value falls (-2.4%).

This shows the importance of granular information, and how misleading overall averages can be.

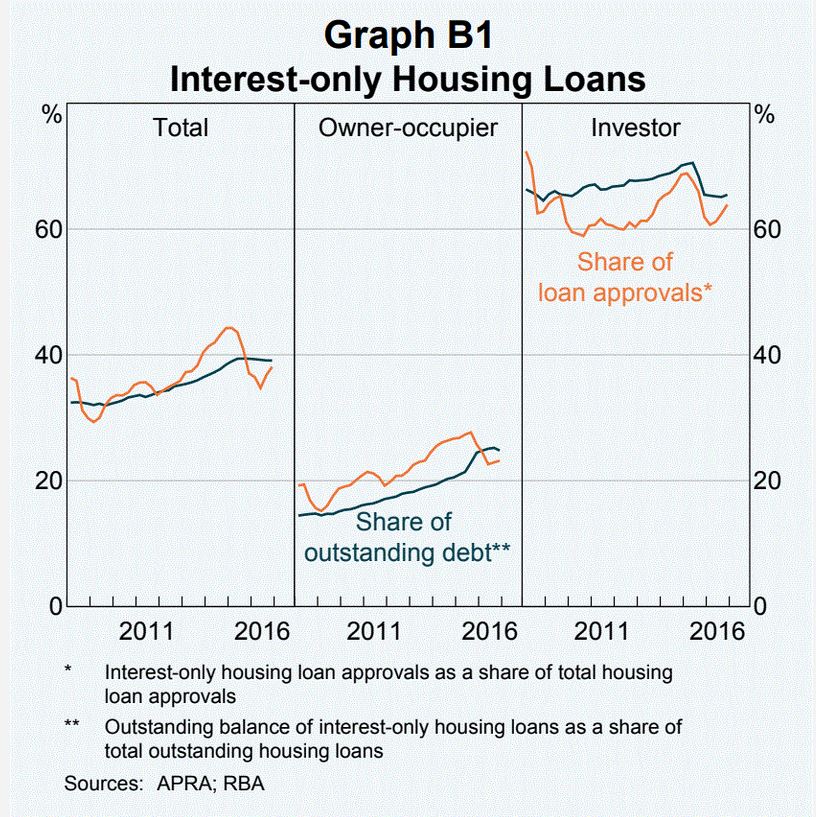
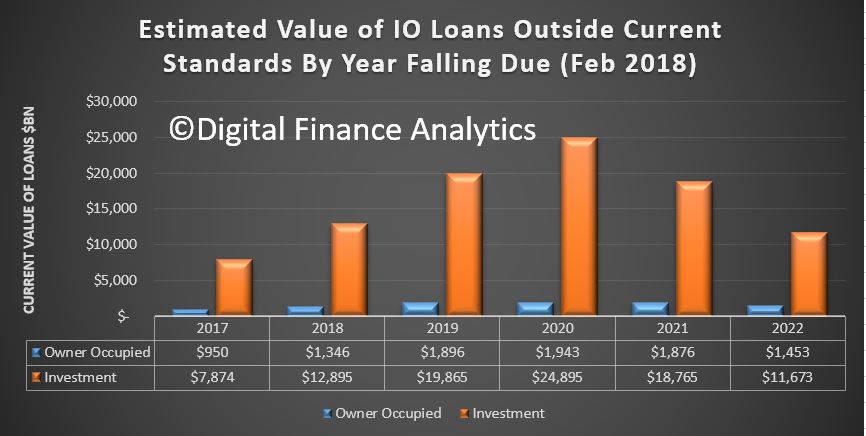
The RBA has released their Financial Stability Review today. It is worth reading the 70 odd pages as it gives a comprehensive picture of the current state of play, though through the Central Bank’s rose-tinted spectacles! They do talk about the risks of high household debt, and warn of the impact of rising interest rates ahead. They home in on the say $480 billion interest only mortgage loans due for reset over the over the next four years, which is around 30 per cent of outstanding loans. Resets to principal and interest will lift repayments by at least 30%. Some borrowers will be forced to sell.

This scenario mirrors the roll over of adjustable rate home loans in the United States which triggered the 2008 sub-prime mortgage crisis. Perhaps this is our own version! We have previously estimated more than $100 billion in these loans would now fail current tighter underwriting standards.

I published a more comprehensive review of the Financial Stability Review, and you can watch the video on this report.  Importantly the RBA suggests that banks broke the rules in their lending on interest only loans before changes were made to regulation in 2014.  The RBA says that there is the potential that these will result in banks having to set aside provisions and/or face penalties for past misconduct or perhaps (more notably) being constrained in the operation of parts of their businesses.

We also did a video on the RBA Chart pack which was released recently.  Household consumption is still higher than disposable income, and the gap is being filled by the falling savings ratio. So, we are still spending, but raiding our savings to do so. Which of course is not sustainable.  Now the other route to fund consumption is debt, so there should be no surprise to see that total household debt rose again (note this is adjusted thanks to changes in the ABS data relating to superannuation, we have previously breached the 200% mark). But on the same chart we see home prices are now falling – already the biggest fall since the GFC in 2007.

We see all the signs of issues ahead, with household debt still rising, household consumption relying on debt and savings, and overall growth still over reliant on the poor old household sector. We need a proper plan B, where investment is channelled into productive growth investments, not just more housing loans.  Yet regulators and government appear to rely on this sector to make the numbers work – but it is, in my view, lipstick on a pig!

Another important report came out from The Bank for International Settlements, the “Central Bankers Banker” has just released an interesting, and concerning report with the catchy title of “Financial spillovers, spillbacks, and the scope for international macroprudential policy coordination“. But in its 53 pages of “dry banker speak” there are some important facts which shows just how much of the global financial system is now interconnected. They start by making the point that over the past three decades, and despite a slowdown coinciding with the global financial crisis (GFC) of 2007–09, the degree of international financial integration has increased relentlessly. In fact the rapid pace of financial globalisation over the past decades has also been reflected in an over sixfold increase in the external assets and liabilities of nations as a share of GDP – despite a marked slowdown in the growth of cross-border positions in the immediate aftermath of the GFC. My own take is that we have been sleepwalking into a scenario where large capital flows and international financial players operating cross borders, negating the effectiveness of local macroeconomic measures, to their own ends.  This new world is one where large global players end up with more power to influence outcomes than governments. No wonder that they often march in step, in terms of seeking outcomes which benefit the financial system machine. You can watch our separate video discussion on this report. Somewhere along the road, we have lost the plot, but unless radical changes are made, the Genie cannot be put back into the bottle. This should concern us all.

And there was further evidence of the global connections in a piece from From The St. Louis Fed On The Economy Blog  which discussed the decoupling of home ownership from home price rises. They say recent evidence indicates that the cost of buying a home has increased relative to renting in several of the world’s largest economies, but the share of people owning homes has decreased. This pattern is occurring even in countries with diverging interest rate policies. And the causes need to be identified. We think the answer is simple: the financialisation of property and the availability of credit at low rates explains the phenomenon.

And finally on the global economy, Vice-President of the Deutsche Bundesbank Prof. Claudia Buch spoke on “Have the main advanced economies become more resilient to real and financial shocks? and makes three telling points. First, favourable economic prospects may lead to an underestimation of risks to financial stability. Second resilience should be assessed against the ability of the financial system to deal with unexpected events. Third there is the risk of a roll back of reforms. The warning is clear, we are not prepared for the unexpected, and as we have been showing, the risks are rising.

Locally more bad bank behaviour surfaced this week. ASIC says it accepted an enforceable undertaking from Commonwealth Financial Planning Limited  and BW Financial Advice Limited, both wholly owned subsidiaries of the Commonwealth Bank of Australia (CBA). ASIC found that CFPL and BWFA failed to provide, or failed to locate evidence regarding the provision of, annual reviews to approximately 31,500 ‘Ongoing Service’ customers in the period from July 2007 to June 2015 (for CFPL) and from November 2010 to June 2015 (for BWFA). They will pay a community benefit payment of $3 million in total. Cheap at half the price!

In similar vein,   ASIC says it has accepted an enforceable undertaking from Australia and New Zealand Banking Group Limited (ANZ) after an investigation found that ANZ had failed to provide documented annual reviews to more than 10,000 ‘Prime Access’ customers in the period from 2006 to 2013. Again, they will pay a community benefit payment of $3 million in total.

Both these cases were where the banks took fees for services they did not deliver – and this once again highlight the cultural issues within the banks, were profit overrides good customer outcomes. We suspect we will hear more about poor cultural norms this coming week as the Royal Commission hearing recommence with a focus on financial planning and wealth management.

Finally to home lending. The ABS released their February 2018 housing finance data. Where possible we track the trend data series, as it irons out some of the bumps along the way. The bottom line is investor as still active but at a slower rate. Some are suggesting there is evidence of stabilisation, but we do not see that in our surveys. Owner occupied loans, especially refinancing is growing quite fast – as lenders seek out lower risk refinance customers with attractive rates. First time buyers remain active, but comprise a small proportion of new loans as the effect of first owner grants pass, and lending standards tighten. You can watch our video on this.

But the final nail in the coffin was the announcement from Westpac of significantly tighten lending standards, with a forensic focus on household expenditure.  They have updated their credit policies so borrower expenses will need to be captured at an “itemised and granular level” across 13 different categories and include expenses that will continue after settlement as well as debts with other institutions. They will also be insisting on documentary proof. Moreover, households will be required to certify their income and expenses is true. This cuts to the heart of the liar loans issue, as laid bare in the Royal Commission. That said, Despite the commission raising questions over whether the use of benchmarks is appropriate when assessing the suitability of a loan for a customer, the Westpac Group changes will still apply either the higher of the customer-declared expenses or the Household Expenditure Measure (HEM) for serviceability purposes. You can watch our separate video on this. Almost certainly other banks will follow and tighten their verification processes. This will put more downward pressure on lending multiples, and will lead to a drop in credit, with a follow on to put downward pressure on home prices.

We discussed this in an article which was published under my by-line in the Australian this week, where we argued that excess credit has caused the home price bubble, and as credit is reversed, home prices will fall.

Our central case is for a fall on average of 15-20% by the end of 2019, assuming no major international incidents. The outlook remains firmly on the downside in our view.


The Housing Boom Is “Officially” Over – The Property Imperative 07 Apr 2018

Welcome to the Property Imperative Weekly to 07 April 2018.

Watch the video, or read the transcript.

In this week’s digest of finance and property news, we start with Paul Keating’s (he of the recession we had to have fame), comment that the housing boom is really over at the recent AFR conference.

He said that the banks were facing tighter controls as a result of the Basel rules on capital adequacy, while financial regulators had had a “gutful” of them. This was likely to lead to changes that would restrict the banks’ ability to lend. He cited APRA’s recent interventions in interest only loans as one example, as they restrict their growth. Keating also said the royal commission into misconduct in the banking and financial services sector would also “make life harder” for the banks and pointed out that banks did not really want to lend to business these days and would “rather just do housing loans”. Finally, he spoke of the “misincentives” within the big banks to grow their business by writing new mortgages, including having a high proportion of interest-only lending.

Anna Bligh speaking at the AFR event, marked last Tuesday her first year as CEO of the Australian Banking Association (ABA) – but said she feels “like 500 years” have already passed. Commenting on the Royal Commission she warned that credit could become tighter ahead. The was she said an opportunity for a major reset, not only in how we do banking but how we think about it, its place in our lives, its role in our economy and, most of all, it’s trustworthiness”.

At the same conference, Rod Simms the Chair of the ACCC speech “Synchronised swimming versus competition in banking” He discussed the results of their recent investigation into mortgage pricing, and also discussed the broader issues of competition versus financial stability in banking. He warned that the industry should be aware of, and respond to, the fact that the drive for consumers to get a better deal out of banking is shared by many beyond the ACCC. Every household in Australia is watching.  You can watch our video blog on this for more details.

He specifically called out a lack of vigorous mortgage price competition between the five big Banks, hence “synchronised swimming”. Indeed, he says discounting is not synonymous with vigorous price competition. They saw evidence of communications “referring to the need to avoid disrupting mutually beneficial pricing outcomes”.

He also said residential mortgages and personal banking more generally make one of the strongest cases for data portability and data access by customers to overcome the inertia of changing lenders.

Finally, on competition. he says if we continue to insulate our major banks from the consequences of their poor decisions, we risk stifling the cultural change many say is needed within our major banks to put the needs of their customers first. Vigorous competition is a powerful mechanism for driving improved efficiency, and also for driving improved price and service offerings to customers. It can in fact lead to better stability outcomes.

This puts the ACCC at odds with APRA who recent again stated their preference for financial stability over competition – yet in fact these two elements are not necessarily polar opposites!

Then there was the report from the good people at UBS has published further analysis of the mortgage market, arguing that the Royal Commission outcomes are likely to drive a further material tightening in mortgage underwriting. As a result, they think households “borrowing power” could drop by ~35%, mainly thanks to changes to analysis of expenses, as the HEM benchmark, so much critised in the Inquiry, is revised. Their starting point assumes a family of four has living expenses equal to the HEM ‘Basic’ benchmark of $32,400 p.a. (ie less than the Old Age Pension). This is broadly consistent with the Major banks’ lending practices through 2017. As a result, the borrowing limits provided by the banks’ home loan calculators fell by ~35% (Loan-to-Income ratio fell from ~5-6x to ~3-4x). This leads to a reduction in housing credit and a further potential fall in home prices.

Our latest mortgage stress data, which was picked by Channel Nine and 2GB, thanks to Ross Greenwood, Across Australia, more than 956,000 households are estimated to be now in mortgage stress (last month 924,500). This equates to 30.0% of households. In addition, more than 21,000 of these are in severe stress, no change from last month. We estimate that more than 55,000 households risk 30-day default in the next 12 months. We expect bank portfolio losses to be around 2.8 basis points, though with losses in WA are higher at 4.9 basis points.  Flat wages growth, rising living costs and higher real mortgage rates are all adding to the burden. This is not sustainable and we are expecting lending growth to continue to moderate in the months ahead as underwriting standards are tightened and home prices fall further”. The latest household debt to income ratio is now at a record 188.6. You can watch our separate video blog on this important topic.

ABS data this week showed The number of dwellings approved in Australia fell for the fifth straight month in February 2018 in trend terms with a 0.1 per cent decline. Approvals for private sector houses have remained stable at around 10,000 for a number of months. But unit approvals have fallen for five months. Overall, building activity continues to slow from its record high in 2016. And the sizeable fall in the number of apartments and high density dwellings being approved comes at a time when a near record volume are currently under construction. If you assume 18-24 months between approval and completion, then we still have 150,000 or more units, mainly in the eastern urban centres to come on stream. More downward pressure on home prices. This helps to explain the rise in 100% loans on offer via some developers plus additional incentives to try to shift already built, or under construction property.

CoreLogic reported  last week’s Easter period slowdown saw 670 homes taken to auction across the combined capital cities, down significantly on the week prior when a record number of auctions were held (3,990). The lower volumes last week returned a higher final clearance rate, with 64.8 per cent of homes selling, increasing on the 62.7 per cent the previous week.  Both clearance rate and auctions volumes fell across Melbourne last week, with only 152 held and 65.5 per cent clearing, down on the week prior when 2,071 auctions were held across the city returning a slightly higher 65.8 per cent success rate.

Sydney had the highest volume of auctions of all the capital city auction markets last week, with 394 held and a clearance rate of 67.9 per cent, increasing on the previous week’s 61.1 per cent across a higher 1,383 auctions.

Across the smaller capital cities, clearance rates improved week-on-week in Canberra, Perth and Tasmania; however, volumes were significantly lower across each market last week compared to the week prior.

Across the non-capital city auction markets, the Geelong region recorded the strongest clearance rate last week with 100 per cent of the 20 auction results reporting as successful.

The number of homes scheduled to go to auction this week will increase across the combined capital cities with 1,679 currently being tracked by CoreLogic, up from last week when only 670 auctions were held over the Easter period slowdown.

Melbourne is expected to see the most significant increase in volumes this, with 669 properties scheduled for auction, up from 152 auctions held last week. In Sydney, 725 homes are set to go to auction this week, increasing on the 394 held last week.

Outside of Sydney and Melbourne, each of the remaining capital cities will see a higher number of auctions this week compared to last week.

Overall auction activity is set to be lower than one year ago, when 3,517 were held over what was the pre-Easter week last year.

Finally, with local news all looking quite negative, let’s look across to the USA as the most powerful banker in the world, JPMorgan Chase CEO Jamie Dimon, just released his annual letter to shareholders.  Given his bank’s massive size (it earned $24.4 billion on $103.6 billion in revenue last year) and reach (it’s a giant in consumer/commercial banking, investment banking and wealth management), Dimon has his figure on the financial pulse.

He says that’s while the US economy seems healthy today and he’s bullish for the “next year or so” he admits that the US is facing some serious economic headwinds.

For one, he’s concerned the unwinding of quantitative easing (QE) could have unintended consequences. Remember- QE is just a fancy name for the trillions of dollars that the Federal Reserve conjured out of thin air.

He said – Since QE has never been done on this scale and we don’t completely know the myriad effects it has had on asset prices, confidence, capital expenditures and other factors, we cannot possibly know all of the effects of its reversal.

We have to deal with the possibility that at one point, the Federal Reserve and other central banks may have to take more drastic action than they currently anticipate – reacting to the markets, not guiding the markets.

And of course the DOW finished the week on a down trend, down 2.34%, and wiping out all the value gained this year, and volatility is way up. Here is a plot of the DOW.

This extreme volatility does suggest the bull market is nearing its end… if it hasn’t ended already. Dimon seems pretty sure we’re in for more volatility and higher interest rates. One scenario that would require higher rates from the Fed is higher inflation:

If growth in America is accelerating, which it seems to be, and any remaining slack in the labor markets is disappearing – and wages start going up, as do commodity prices – then it is not an unreasonable possibility that inflation could go higher than people might expect.

As a result, the Federal Reserve will also need to raise rates faster and higher than people might expect. In this case, markets will get more volatile as all asset prices adjust to a new and maybe not-so-positive environment.

Now– here’s the important part. For the past ten years, the largest buyer of US government debt was the Federal Reserve. But now that QE has ended, the US government just lost its biggest lender.

Dimon thinks other major buyers, including foreign central banks, the Chinese, etc. could also reduce their purchases of US government debt. That, coupled with the US government’s ongoing trade deficits (which will be funded by issuing debt), could also lead to higher rates…

So we could be going into a situation where the Fed will have to raise rates faster and/ or sell more securities, which certainly could lead to more uncertainty and market volatility. Whether this would lead to a recession or not, we don’t know.

We’ll leave you with one final point from Jamie Dimon. He acknowledges markets have a mind of their own, regardless of what the fundamentals say. And he sees a real risk “that volatile and declining markets can lead to a market panic.”

Financial markets have a life of their own and are sometimes barely connected to the real economy (most people don’t pay much attention to the financial markets nor do the markets affect them very much). Volatile markets and/or declining markets generally have been a reaction to the economic environment. Most of the major downturns in the market since the Great Depression reflect negative future expectations due to a potential or real recession. In almost all of these cases, stock markets fell, credit losses increased and credit spreads rose, among other disruptions. The biggest negative effect of volatile markets is that it can create market panic, which could start to slow the growth of the real economy. Because the experience of 2009 is so recent, there is always a chance that people may overreact.

Dimon cautioned investors that interest rates could rise much sooner than they expect. If inflation suddenly comes roaring back. Indeed, it’s entirely possible the 10-year could break above 4% in the near future as inflation returns to 2% and the Fed shrinks its balance sheet.

Dimon also cast a wary eye toward exchange-traded funds, which have seen their popularity multiply since the financial crisis. There are now many ETF products that are considerably more liquid than their underlying assets. In fact far more money than before (about $9 trillion of assets, which represents about 30% of total mutual fund long-term assets) is managed passively in index funds or ETFs (both of which are very easy to get out of). Some of these funds provide far more liquidity to the customer than the underlying assets in the fund, and it is reasonable to worry about what would happen if these funds went into large liquidation.

And Finally America’s net debt currently stands at 77% of GDP (this is already historically high but not unprecedented). The chart below also shows the Congressional Budget Office’s estimate of the total U.S. debt to GDP, assuming a 2% real GDP growth rate. Hopefully, with the right policies they can grow faster than 2%. But more debt does seem on the cards.

And to add to that perspective, we spoke about the recent Brookings report which highlighted the rise in non conforming housing debt in the USA. debt as lending standards are once again being loosened, and risks to mortgage services are rising.

The authors quote former Ginnie Mae president Ted Tozer concerning the stress between Ginnie Mae and their nonbank counterparties.

… Today almost two thirds of Ginnie Mae guaranteed securities are issued by independent mortgage banks. And independent mortgage bankers are using some of the most sophisticated financial engineering that this industry has ever seen. We are also seeing greater dependence on credit lines, securitization involving multiple players, and more frequent trading of servicing rights and all of these things have created a new and challenging environment for Ginnie Mae. . . . In other words, the risk is a lot higher and business models of our issuers are a lot more complex. Add in sharply higher annual volumes, and these risks are amplified many times over. . . . Also, we have depended on sheer luck. Luck that the economy does not fall into recession and increase mortgage delinquencies. Luck that our independent mortgage bankers remain able to access their lines of credit. And luck that nothing critical falls through the cracks…

They say that goldfish have the shortest memory in the Animal Kingdom… something like 3-seconds. But not even a decade after these loans nearly brought down the entire global economy, SUBPRIME IS BACK. In fact it’s one of the fastest growing investments among banks in the United States. Over the last twelve months the subprime volume among US banks doubled, and it’s already on pace to double again this year.

What could possibly go wrong?

The Property Imperative Weekly – 31 March 2018

Welcome to the Property Imperative Weekly to 31st March 2018.

Watch the video or read the transcript.

In this week’s review of property and finance news we start with the latest CoreLogic data on home price movements.

Looking at their weekly index, after last week’s brief lift, values fell 0.17% in the past week and as a result Sydney home values have now declined by a cumulative 4.2% over the past 29-weeks, with values also down 4.1% over the past 34 weeks. Sydney’s quarterly growth rate remains firmly negative, down 1.8% according to CoreLogic and annual growth is also down 2.2%.

More granular analysis shows the most significant falls in higher value property, and also in high-rise apartments. Our own analysis, and feedback from our followers is that asking prices are falling quite consistently now, and the same trend is to be see in Brisbane and Melbourne, our largest markets. This despite continued strong migration. We see two trends emerging, more people getting desperate to sell, so putting their property on the market, and having to accept a deeper discount to close a sale.

As we showed this week in our separate videos on the latest results from our surveys, down traders in particular are seeking to release capital now, and there are more than 1 million who want to transact. On the other hand investors are fleeing, though some are now also being forced to sell thanks to the switch from interest only to more expensive principal and interest loans.

This is all consistent with the latest auction results, which Corelogic also reported. They said that volumes last week broke a new record with 3,990 homes taken to auction across the combined capital cities in the lead up to Easter, which exceeded the previous high of 3,908 over the week ending 30th November 2014. The preliminary clearance rate was reported at 65.5%, but the final auction clearance rate fell to 62.7 per cent last week, down from 66.0 per cent across 3,136 auctions the previous week. Over the same week last year, 3,171 auctions were held, returning a significantly stronger clearance rate (74.5 per cent).

CoreLogic said that Melbourne’s clearance rate last week was 65.8 per cent across 2,071 auctions, making it the busiest week on record for the city. In comparison, there were 1,653 auctions held across the city over the previous week, returning a clearance rate of 68.7 per cent. This time last year, 1,607 homes were taken to auction, and a clearance rate of 78.9 per cent was recorded. Sydney was host to 1,383 auctions last week, the most auctions held across the city since the week leading up to Easter 2017 (1,436), while over the previous week, 1,093 auctions were held. The clearance rate for Sydney fell to 61.1 per cent, down from 64.8 per cent over the previous week, while this time last year, Sydney’s clearance rate was a stronger 75.8 per cent.

Across the smaller auction markets, auction volumes increased week-on-week, however looking at clearance rates, Adelaide (64.6 per cent) and Canberra (69.1 per cent) were the only cities to see a slight rise in the clearance rate over the week.

The Gold Coast region was the busiest non-capital city region last week with 87 homes taken to auction, while Geelong recorded the highest clearance rate at 79.7 per cent across 75 auctions.

Given the upcoming Easter long weekend, auction volumes are much lower this week with only 540 capital city auctions scheduled; significantly lower than last week when 3,990 auctions were held across the combined capital cities.

The next question to consider is the growth in credit. As we discussed in a separate blog, credit for housing, especially owner occupied mortgages is still running hot.  The smoothed 12 months trends from the RBA, out last Thursday, shows annualised owner occupied growth registering 8.1%, up from last month, investor lending falling again down to 2.8% annualised, and business credit at just 3.6%

Looking at the relative value of lending, in seasonally adjusted terms, owner occupied credit rose 0.71% to $1.15 trillion, up $8.08 billion, while investment lending rose 0.12% to $588.3 billion, up just 0.69 billion. Business lending rose 0.17% to $905 billion, up 1.55 billion and personal credit fell 0.15%, down 0.22 billion to $152.2 billion.

Note that the proportion of investment loans fell again down to 33.9%, and the proportion of business lending to all lending remained at 32.4%, and continues to fall from last year. In other words, it is owner occupied housing which is driving credit growth higher – if this reverses, there is a real risk total credit grow will run into reverse. Again, we see the regulators wishing to continue to drive credit higher, to support growth and GDP, yet also piling on more risks, when households are already terribly exposed. They keep hoping business investment and growth will kick in, but their forward projections look “courageous”. Remember it was housing consumption and Government spending on infrastructure which supported the last GDP numbers, not business investment.

Now, let’s compare the total housing lending from the RBA of $1.74 trillion, which includes the non-banks (though delayed, and partial data), with the APRA $1.61 trillion. The gap, $130 billion shows the non-bank sector is growing, as historically, the gap has been closer to $110 billion. This confirms the non-bank sector is active, filling the gap left by banks tightening. Non-banks have weaker controls on their lending, despite the new APRA supervision responsibilities. This is an emerging area of additional risk, as some non-banks are ready and willing to write interest only and non-conforming loans, supported by both new patterns of securitisation (up 13% in recent times) and substantial investment funds from a range of local and international investors and hedge funds.

Once again, we see the regulators late to the party.  This continues the US 2005-6 playbook where non-conforming loans also rose prior to the crash. We are no different.

The ABS released more census data this week, and focussed on the relative advantage and disadvantage across the country. Ku-ring-gai on Sydney’s upper north shore is Australia’s most advantaged Local Government Area (LGA). Another Sydney LGA, Mosman, which includes the affluent suburbs of Balmoral, Beauty Point and Clifton Gardens, has also been ranked among the most advantaged. In fact, SEIFA data shows the 10 most advantaged LGAs in Australia are all located around the Northern and Eastern areas of Sydney Harbour and in coastal Perth.

The most disadvantaged LGA is Cherbourg, approximately 250 kilometres north-west of Brisbane (QLD), followed by West Daly (NT). The 10 most disadvantaged LGAs in Australia can be found in Queensland and the Northern Territory.

The latest data has found that more than 30 per cent of people born in China, South Africa and Malaysia live in advantaged areas and less than 10 per cent reside in disadvantaged areas. Meanwhile, 40 per cent of Vietnamese-born live in disadvantaged areas and only a small proportion (11 per cent) live in advantaged areas.

People of Aboriginal and/or Torres Strait Islander origin are more likely to live in the most disadvantaged areas with 48 per cent living in the bottom fifth most disadvantaged LGAs, compared to 18 per cent of non-Indigenous people. Overall, only 5.4 per cent of Aboriginal and/or Torres Strait Islander people live in areas of high relative advantage compared with 22 per cent of non-Indigenous people.

What the ABS did not show is that there is a strong correlation of those defined as advantaged to valuable real estate – home price rises have both catalysed the economic disparities across the country, and of course show the venerability that more wealthy areas have should home prices fall further. The paper value of property is largely illusory, and of course only crystallises when sold.

The HIA reported that new home sales declined for the second consecutive month during February 2018 overall, but the markets were patchy, based on results contained in the latest edition of their New Home Sales report – a monthly survey of the largest volume home builders in the five largest states.

Despite the fact that the overall volume of sales declined during February, reductions only occurred in two of the five states covered by the HIA New Home Sales Report – the magnitude of these reductions outweighed the increases which took place elsewhere. The largest fall was in Queensland (-16.3 per cent) with a 9.9 per cent contraction recorded in WA. The largest increase in sales was in NSW (+11.7 per cent), followed by SA (+10.3 per cent) and Victoria (+4.8 per cent).

Finally, we walked through our survey results in a series of separate videos, but in summary, the latest release of the Digital Finance Analytics Household Survey to end March 2018, helps to explain why we think home prices are set to fall further by drawing on our 52,000 sample, from across Australia.

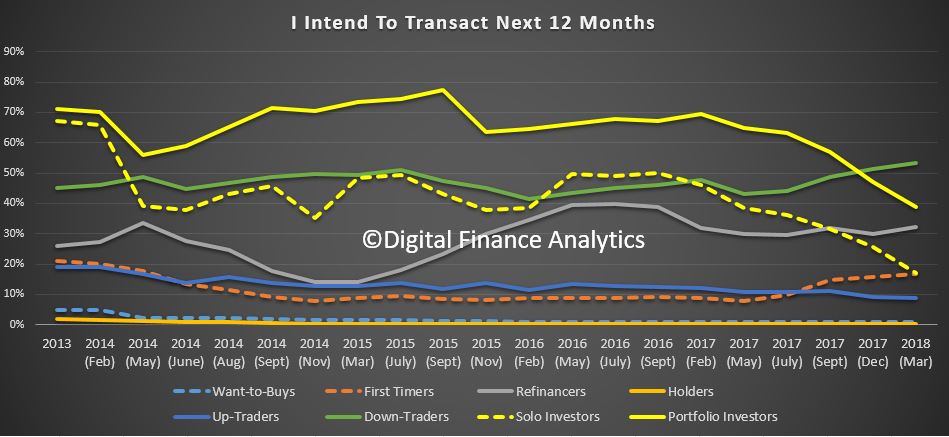
This chart, which looks across our property segments, shows that both portfolio property investors (who hold multiple properties) and solo investors (who hold one, or perhaps two) intentions to transact are tanking, down 8% since December 2017. This is because credit is less available, capital growth has stalled, and in fact only the tax breaks remain as an incentive! This decline started in 2015, but is accelerating.  Remember that around one thirrd of mortgages are for investment purposes, so as this demand dissipates, the floor on prices starts to shatter.

Whilst there are offsetting rises from down traders (who are seeking to release capital before prices fall further) and first time buyers (who are being “bribed” by first owner grants) there is a significant net fall in demand. This pattern is seen across the country, but is most prevalent in our two biggest markets of Sydney and Melbourne.

Refinancing is up a little, thanks to the attractive discounts being offered by many lenders, and the prime driver is to reduce monthly repayments, as currently household finances are under pressure. We release the latest mortgage stress analysis in a few days.

And if you want to think about the consequences of all this, then watch our commentary on the Four Scenarios which portrays how the property and finance sector may play out, and compare the comments from APRA with those in Ireland in 2007 in our latest video blog – they are eerily similar, and we all know what happened there!

The outlook for finance and property in Australia in decidedly uncertain.

Latest Survey – Why Home Prices Will Fall Further

The latest release of the Digital Finance Analytics Household Survey to end March 2018, helps to explain why we think home prices are set to fall further. We discussed four housing and property scenarios in a recent video blog.

But drawing on our 52,000 sample, from across Australia, today we will walk through the top-level survey findings, before later drilling into the segment specific data in later posts. You can read about our household segmentation models here.  This analysis of course then feeds into our Property Imperative Report, which we publish twice each year as a summary of our research and analysis. The last edition – volume 9 – from 2017 is still available on request.

Read the transcript. or watch the video.

The first chart, which looks across our property segments, shows that both portfolio property investors (who hold multiple properties) and solo investors (who hold one, or perhaps two) intentions to transact are tanking, down 8% since December 2017. As we will see later, this is because credit is less available, capital growth has stalled, and in fact only the tax breaks remain as an incentive! This decline started in 2015, but is accelerating.  Remember that 35% of mortgages are for investment purposes, so as this demand dissipates, the floor on prices starts to shatter.

Whilst there are offsetting rises from  down traders (who are seeking to release capital before prices fall further) and first time buyers (who are being “bribed” by first owner grants) there is a significant net fall in demand. This pattern is seen across the country, but is most prevalent in our two biggest markets of Sydney and Melbourne.

Refinancing is up a little, thanks to the attractive discounts being offered by many lenders, and as we will see the prime driver is to reduce monthly repayments, as currently household finances are under pressure. We release the latest mortgage stress analysis in a few days.

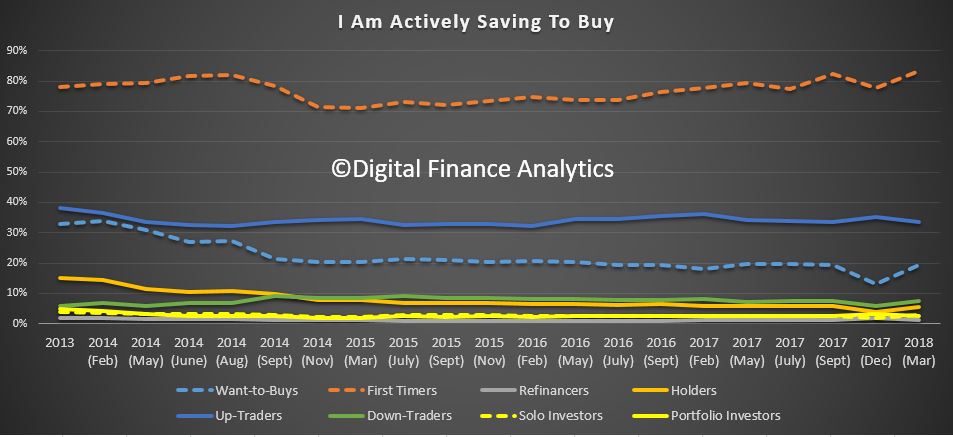
First time buyers and those wanting to buy, are saving a little more in an attempt to access the market, and those planning to trade up are also still putting some funds aside, otherwise, there is little evidence of concerted attempts to save cash for property transactions.

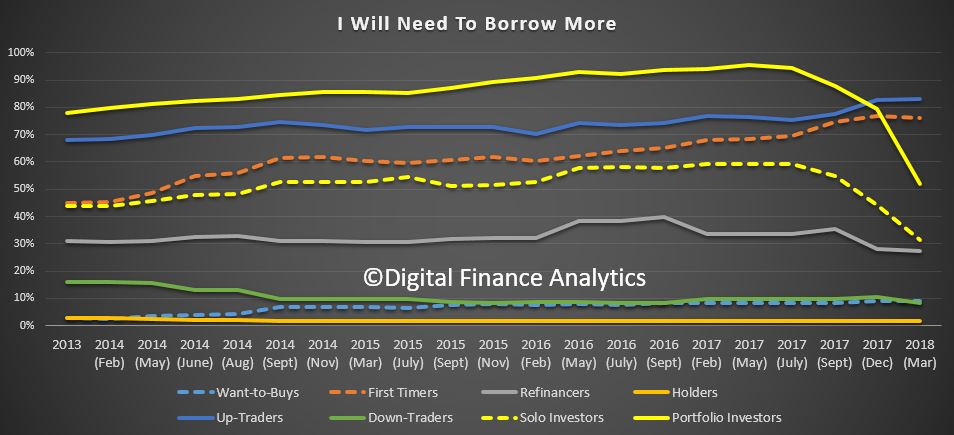
Turning for demand for credit, we see is crashing, especially in the investment segments. There was a 12% fall in the solo property investor group and an amazing 27% fall in the portfolio investor segment.  One of the clearest messages from the survey is how much lending standards just got tighter, with an average 20% drop in “borrowing power” compared with a few months ago. As a result many first time buyers and investors simply cannot get credit, because they cannot meet the tighter requirements. The outfall from the Royal Commission will simply exacerbate the situation. There is a strong link between home prices and credit supply, so this will put further downward pressure on property values.

Refinancing households are tending not now to seek to release additional capital from their properties, as part of a refinance deal.  We also note a rise in those being forced to refinance from interest only loans to principal and interest loans, and our latest modelling still is tracking an estimated $100 billion problem.

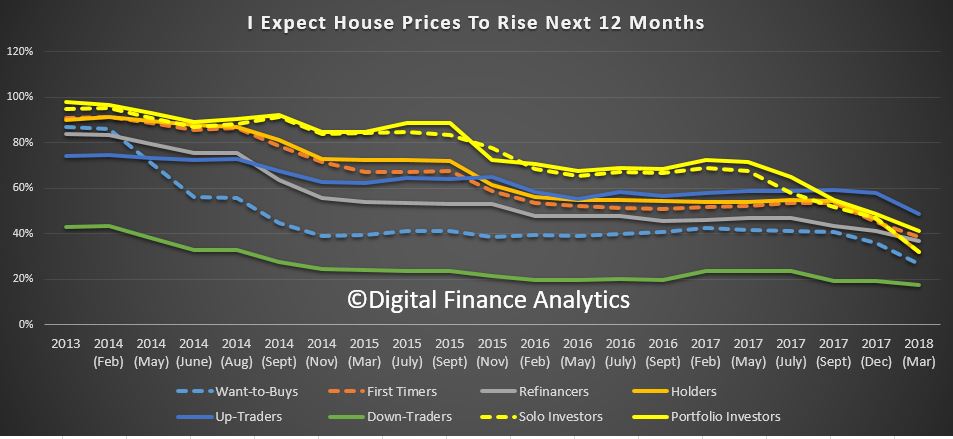
We find that ever fewer households are expecting home prices to rise, this registered across the board – but the trajectory down is strongest among investors. No segment is more bullish on prices compared with last year. This falling trend is strongest in Sydney, but Melbourne appears to be following about 6 months later. Households in Perth and Hobart are more bullish, but only slightly, and this was not enough to prevent the general decline. Remember WA has seen prices slide in recent years.

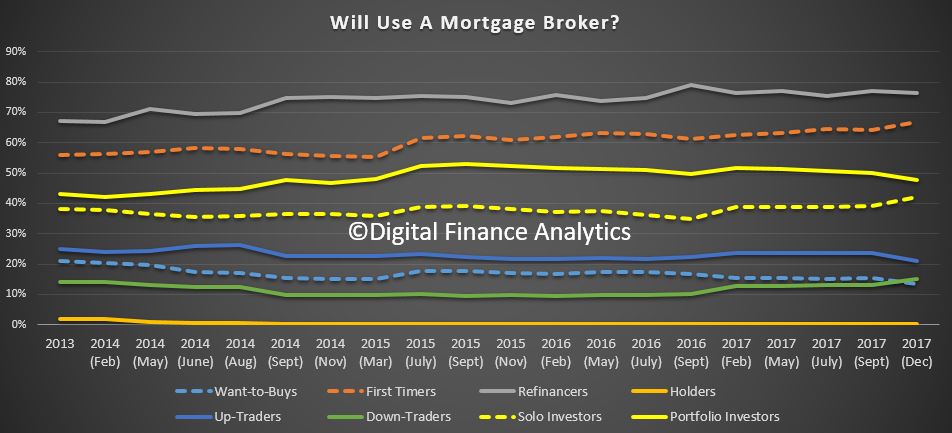
Households use of mortgage brokers appears pretty consistent (even if the volume of transactions is falling). Those seeking to refinance are most likely to approach a broker, followed by first time buyers.

Next time we will look in more detail at the underlying drivers by segments. But current home prices appear to have no visible means of support – they are going to fall further.


The Financial Market Earthquakes – The Property Imperative Weekly 24 March 2018

Today we examine the recent Financial Market Earthquakes and ask, are these indicators of more trouble ahead?

Welcome to the Property Imperative Weekly to 24th March 2018. Watch the video or read the transcript.

In this week’s review of property and finance news we start with the recent market movements and consider the impact locally.

The Dow 30 has come back, slumping more than 1,100 points between Thursday and Friday, and ending the week in correction territory – meaning down more than 10% from its recent high.

The volatility index – the VIX which shows the perceived risks in the financial markets also rose, up 6.5% just yesterday to 24.8, not yet at the giddy heights it hit in February, but way higher than we have seen for a long time – so perceived risks are higher.

And the Aussie Dollar slipped against the US$ to below 77 cents from above 80, and it is likely to drift lower ahead, which may help our export trade, but will likely lead to higher costs for imports, which in turn will put pressure on inflation and the RBA to lift the cash rate. The local stock market was also down, significantly. Here is a plot of the S&P ASX 100 for the past year or so. We are back to levels last seen in October 2017. Expect more uncertainty ahead.

So, let’s look at the factors driving these market gyrations. First of course U.S. President Donald Trump’s signed an executive memorandum, imposing tariffs on up to $50 billion in Chinese imports and in response the Dow slumped more than 700 points on Thursday. There was a swift response from Beijing, who released a dossier of potential retaliation targets on 128 U.S. products. Targets include wine, fresh fruit, dried fruit and nuts, steel pipes, modified ethanol, and ginseng, all of which could see a 15% duty, while a 25% tariff could be imposed on U.S. pork and recycled aluminium goods. We also heard Australia’s exemptions from tariffs may only be temporary.

Some other factors also weighed on the market. Crude oil prices rose more than 5.5% this week as following an unexpected draw in U.S. crude supplies and rising geopolitical tensions in the middle east. Crude settled 2.5% higher on Friday after the Saudi Energy Minister said OPEC and non-OPEC members could extend production cuts into 2019 to reduce global oil inventories. Here is the plot of Brent Oil futures which tells the story.

Bitcoins promising rally faded again.  Earlier Bitcoin rallied from a low of $7,240 to a high of $9175.20 thanks to easing fears that the G20 meeting Monday would encourage a crackdown on cryptocurrencies. Finance ministers and central bankers from the world’s 20 largest economies only called on regulators to “continue their monitoring of crypto-assets” and stopped short of any specific action to regulate cryptocurrencies. So Bitcoin rose 2% over the past seven days, Ripple XRP fell 8.93%and Ethereum fell 14.20%. Crypto currencies remain highly speculative. I am still working on my more detailed post, as the ground keeps shifting.

Gold prices enjoyed one of their best weeks in more than a month buoyed by a flight-to-safety as investors opted for a safe-haven thanks to the events we have discussed. However, the futures data shows many traders continued to slash their bullish bets on gold. So it may not go much higher. So there may be no relief here.

Then there was the Federal Reserve statement, which despite hiking rates by 0.25%, failed to add a fourth rate hike to its monetary policy projections and also scaled back its labour market expectations. Some argued that the Fed’s decision to raise its growth rate but keep its outlook on inflation relatively unchanged was dovish. Growth is expected to run at 3%, but core inflation is forecast for 2019 and 2020 at 2.10%.  They did, however, signal a faster pace of monetary policy tightening, upping its outlook on rates for both 2019 and 2020. You can watch our separate video blog on this. The “dots” chart also shows more to come, up to 8 lifts over two years, which would take the Fed rate to above 3%.  The supporting data shows the economy is running “hot” and inflation is expected to rise further. This will have global impact.  The era of low interest rates in ending. The QE experiment is also over, but the debt legacy will last a generation.

All this will have a significant impact on rates in the financial markets, putting more pressure on borrowing companies in the US, and the costs of Government debt. US mortgage interest rates rose again, a precursor to higher rates down the track.

Moodys’ said this week, that the U.S.’ still relatively low personal savings rate questions how easily consumers will absorb recent and any forthcoming price hikes. Moreover, the recent slide by Moody’s industrial metals price index amid dollar exchange rate weakness hints of a levelling off of global business activity.

The flow on effect of rate rises is already hitting the local banks in Australia.  To underscore that here is a plot of the A$ Bill/OIS Swap rate, a critical benchmark for bank funding. In fact, looking over the past month, the difference, or spread has grown by around 20 basis points, and is independent from any expectation of an RBA rate change.  The BBSW is the reference point used to set interest rates on most business loans, and also flows through to personal lending rates and mortgages.

As a result, there is increasing margin pressure on the banks. In the round, you can assume a 10 basis point rise in the spread will translate to a one basis point loss of margin, unless banks reduce yields on deposit accounts, or lift mortgage rates. Individual banks ae placed differently, with ANZ most insulated, thanks to their recent capital initiatives, and Suncorp the most exposed.

In fact, Suncorp already announced that Variable Owner Occupier Principal and Interest rates will rise by 5 basis points. Variable Investor Principal and Interest rates will increase by 8 basis points, and Variable Interest Only rates increase go up by 12 basis points. In addition, their variable Small Business rates will increase by 15 basis points and their business Line of Credit rates will increase by 25 basis points. Expect more ahead from other lenders.  The key takeaway is that funding costs in Australia are going up at a time when the RBA is stuck in neutral. It highlights how what happens with rates and in money markets overseas, and particularly in the US, can have repercussions here – repercussions that many are possibly unprepared for.

Locally, the latest Australian Bureau of Statistics showed that home prices to December 2017 fell in Sydney over the past quarter, along with Darwin. Other centres saw a rise, but the rotation is in hand. Overall, the price index for residential properties for the weighted average of the eight capital cities rose 1.0% in the December quarter 2017. The index rose 5.0% through the year to the December quarter 2017.

The capital city residential property price indexes rose in Melbourne (+2.6%), Perth (+1.1%), Brisbane (+0.9%), Hobart (+3.9%), Canberra (+1.7%) and Adelaide (+0.6%) and fell in Sydney (-0.1%) and Darwin (-1.5%). You can watch our separate video on this, where we also covered in more detail the January 2018 mortgage default data from Standard & Poor’s. It increased to 1.30% from 1.07% in December. No area was exempt from the increase with loans in arrears by more than 30 days increasing in January in every state and territory. Western Australia remains the home of the nation’s highest arrears, where loans in arrears more than 30 days rose to 2.44% in January from 2.08% in December, reaching a new record high. Conversely, New South Wales continues to have the lowest arrears among the more populous states at 0.98% in January. Moody’s is now expecting a 10% correction in some home prices this year.

According to latest figures released by the Australian Bureau of Statistics (ABS), the seasonally adjusted unemployment rate increased to 5.6 per cent and the labour force participation rate increased by less than 0.1 percentage points to 65.7 per cent.  The number of persons employed increased by 18,000 in February 2018. So no hints of any wage rises soon, as it is generally held that 5% unemployment would lead to higher wages – though even then, I am less convinced.

The latest final auction clearance results from CoreLogic, published last Thursday showed the final auction clearance rate across the combined capital cities rose to 66 per cent across a total of 3,136 auctions last week; making it the second busiest week for auctions this year, compared with 63.3 per cent the previous week, and still well down from 74.1 per cent a year ago. Although Melbourne recorded its busiest week for auctions so far this year with a total of 1,653 homes taken to auction, the final auction clearance rate across the city fell to 68.7 per cent, down from the 70.8 per cent over the week prior.  In Sydney, the final auction clearance rate increased to 64.8 per cent last week, from 62.2 per cent the week prior. Across the smaller auction markets, clearance rates improved in Brisbane, Perth and Tasmania, while Adelaide and Canberra both returned a lower success rate over the week. They say Geelong was the best performing non-capital city region last week, with 86.1 per cent of the 56 auctions successful. However, the Gold Coast region was host to the highest number of auctions (60). This week they are expecting a high 3,689 planned auctions today, so we will see where the numbers end up. I am still digging into the clearance rate question, and should be able to post on this soon. But remember that number, 3,689, because the baseline seems to shift when the results arrive.

As interest rates rise, in a flat income environment, we expect the problems in the property and mortgage sector to show, which is why our forward default projections are higher ahead. We will update that data again at the end of the month. Household Financial Confidence also drifted lower again as we reported. It fell to 94.6 in February, down from 95.1 the previous month. This is in stark contrast to improved levels of business confidence as some have reported. Our latest video blog covered the results.

Finally, The Royal Commission of course took a lot of air time this week, and I did a separate piece on the outcomes yesterday, so I won’t repeat myself. But suffice it to say, we think the volume of unsuitable mortgage loans out there is clearly higher than the lenders want to admit. Mortgage Broking will also get a shake out as we discussed on the ABC this week.  And that’s before they touch on the wealth management sector!

We think there are a broader range of challenges for bankers, and their customers, as I discussed at the Customer Owned Banking Association conference this week.  There is a separate video available, in which you can hear about what the future of banking will look like and the importance of customer centricity. In short, more disruption ahead, but also significant opportunity, if you know where to look. I also make the point that ever more regulation is a poor substitute for the right cultural values.  At the end of the day, a CEO’s overriding responsibility is to define the right cultural values for the organisation, and the major banks have been found wanting. A quest for profit at any cost will ultimately destroy a business if in the process it harms customers, and encourages fraud and deceit. You simply cannot assume banks will do the right thing, unless the underlying corporate values are set right.  Remember Greenspans testimony after the GFC, when he said “I made a mistake in presuming that the self-interests of organisations, specifically banks and others, were such that they were best capable of protecting their own shareholders and their equity in the firms.”

The Mortgage Industry Omnishambles – The Property Imperative 17 March 2018

Today we examine the Mortgage Industry Omnishambles. And it’s more than just a flesh wound!

Welcome to the Property Imperative Weekly to 17th March 2018. Watch the video, or read the transcript.

In this week’s review of property and finance news we start with the latest January data from the ABS which shows lending for secured housing rose 0.14% or 28.8 million to $21.1 billion. Secured alterations fell 1%, down $3.9 million to $391 million.  Fixed personal loans fell 0.1%, down $1.2 million to $4.0 billion, while revolving loans fell 0.06%, down $1.3 million to $2.2 billion.

Investment lending for construction of dwellings for rent rose 0.86% or $10 million to $1.2 billion. Investment lending for purchase by individuals fell 1.34%, down $127.7 million to $9.4 billion, while investment lending by others rose 7.7% up $87.2 million to $1.2 billion.

Fixed commercial lending, other than for property investment rose 1.25% of $260.5 million to $21.1 billion, while revolving commercial lending rose 2.5% or $250 million to $10.2 billion.

The proportion of lending for commercial purposes, other than for investment housing was 45% of all commercial lending, up from 44.5% last month.

The proportion of lending for property investment purposes of all lending fell 0.1% to 16.6%.

So, we are seeing a rotation, if a small one, towards commercial lending for more productive purposes. However, lending for property and for investment purposes remains quite strong. No reason to reduce lending underwriting standards at this stage or weaken other controls.

But this also explains the deep rate cuts the banks are now offering – even to investors – ANZ Bank and the National Australia Bank were the last of the big four to announce cuts to their fixed rates, following similar announcements from the Commonwealth Bank and Westpac. NAB has dropped its five-year fixed rate for owner-occupied, principal and interest home loans by 50 basis points, from 4.59 per cent to 4.09 per cent. The bank has also reduced its fixed rates on investor loans by up to 35 basis points, with rates starting from 4.09 per cent. And last week ANZ also dropped fixed rates on its “interest in advance”, interest-only home loans by up to 40 basis points, with rates starting from 4.11 per cent. Further, fixed rates on its owner-occupied, principal and interest home loans have fallen by 10 basis points, with rates now starting from 3.99 per cent.  This fixed rate war shows our big banks are not pricing in a rate hike anytime soon.

But we think these offers will likely encourage churn among existing borrowers, rather than bring new buyers to the market.  For example, the ABS housing finance data showed that in original terms, the number of first home buyer commitments as a percentage of total owner occupied housing finance commitments rose to 18.0% in January 2018 from 17.9% in December 2017 – and this got the headline from the real estate sector, but the absolute number of first time buyers fell, thanks mainly to falls of 22.3% in NSW and of 13.3% in VIC. More broadly, there were small rises in refinancing and investment loans for entities other than individuals.

The latest data from CoreLogic shows home prices fell again this week, with Sydney down for the 27th consecutive week, and their index registering another 0.09% drop, whilst auction volumes were down on last week. They say that last week, the combined capital city final auction clearance rate fell to 63.3 per cent across a lower volume of auctions with 1,764 held, down from the 3,026 auctions over the week prior when a slightly higher 63.6 per cent cleared.  The weighted average clearance rate has continued to track lower than results from last year; when over the corresponding week 75.1 per cent of the 1,473 auctions sold.

But the strategic issues this week relate to the findings from the Royal Commission and from the ACCC on mortgage pricing. I did a separate video on the key findings, but overall it was clear that there are significant procedural, ethical and even legal issue being raised by the Commission, despite their relatively narrow terms of reference. They cannot comment on bank regulation, or macroprudential, but the Inquiries approach is to examine a series of case studies, from the various submissions they have received, and then apply forensic analysis to dig into the root causes examining misconduct. The question of course is, do the specific examples speak to wider structural questions as we move from the specific instances. We discussed this on ABC Radio this week.

From NAB we heard about referrer’s providing leads to the Bank, outside normal lending practices and processes, and some receiving large commissions, despite not being in the ambit of the responsible lending code. From CBA we heard that the bank was aware of the conflict brokers have especially when recommending an interest only loan, because the trail commission will be higher as the principal amount is not repaid. And from Aussie, we heard about their reliance on lenders to trap fraud, as their own processes were not adequate. And we also heard of examples of individual borrowers receiving loans thanks to poor conduct, or even fraud. We also heard about how income and expenses are sometimes misrepresented. So, the question is, do these various practices show up more widely, and what does this say about liar loans, and mortgage systemic risk?

We always struggled to match the data from our independent household surveys with regards to loan to income, and loan to value, compare with loan portfolios we looked at from the banks. Now we know why. In some cases, income is over stated, expenses are understated, and so loan serviceability is a potentially more significant issue than the banks believe – especially if interest rates rise. In fact, we saw very similar behaviours to the finance industry in the USA before the GFC, suggesting again we may see the same outcomes here. One other point, every lender is now on notice that they need to look at their current processes and back book, to test affordability, serviceability and risk. This is a big deal.

I will also be interested to see if the Commission turns to look at foreclosure activity, because this is the other sleeper. Mortgage delinquency in Australia appears very low, but we suspect this is associated with heavy handed forced sales. Something again which was apparent around the GFC.

More specifically, as we said in a recent blog, the role and remuneration models for brokers are set for a significant shakedown.

Turning to the ACCC report on mortgage pricing, this was also damming. Back in June 2017, the banks indicated that rate increases were primarily due to APRA’s regulatory requirements, but now under further scrutiny they admitted that other factors contributed to the decision, including profitability. Last December, the ACCC was called on by the House of Representatives Standing Committee on Economics to examine the banks’ decisions to increase rates for existing customers despite APRA’s speed limit only targeting new borrowers. The investigation falls under the ACCC’s present enquiry into residential mortgage products, which was established to monitor price decisions following the introduction of the bank levy. Here are the main points.

  1. Banks raised rates to reach internal performance targets: concern about a shortfall relative to performance targets was a key factor in the rate hikes which were applied across the board. Even small increases can have a significant impact on revenue, the report found. And the majority of existing borrowers would likely not be aware of small changes in rates and would therefore be unlikely to switch.
  2. A shared interest in avoiding disruption: Instead of trying to increase market share by offering the lowest interest rates, the big four banks were mainly preoccupied and concerned with each other when making pricing decisions. It shows a failure in competition (my words).
  3. Reputation is everything: The banks it seems were very conscious of how they should explain changes. As it happens, blaming the regulators provides a nice alibi/
  4. For Profit: Internal memos also spoke of the margin enhancement equating to millions of dollars which flowed from lifting investment loans.
  5. New Loans are cheaper, legacy rates are not. Banks of course are offering deep discounts to attract new customers, funded by the back book repricing. The same, by the way, is true for deposits too.

The Australian Bankers Association “silver lining” statement on the report said they welcomed the interim report into residential mortgages, which clearly shows very high levels of discounting in the Australian home loan market. It’s clear that competition is delivering better deals for customers, shopping around works and Australians should continue to do so to get the best discounts on the advertised rate. But they are really missing the point!

We will see if the final report changes, but if not these are damming, but not surprising, and again shows the pricing power the major lenders have.

So to the question of future rate rises. The FED meets this week, and the expectation is they will lift rates again, especially as the TRUMP tax cuts are inflationary, at a time when the US economy is already firing. In a recent report Fitch Ratings said that Central banks are becoming less cautious about normalising monetary policy in the face of strong growth and diminishing spare capacity. They expect the Fed to raise rates no less than seven times before the end of next year. And while still sounding tentative, the European Central Bank is clearly laying firm groundwork for phasing out QE completely later this year. They now also expect the Bank of England to raise rates by 25bp this year.

Guy Debelle, RBA Deputy Governor spoke on “Risk and Return in a Low Rate Environment“.  He explored the consequences of low rates, on asset prices, and asks what happens when rates rise. He suggested that we need to be alert for the effect the rise in the interest rate structure has on financial market functioning, and that investors were potentially too complacent.  There are large institutional positions that are predicated on a continuation of the low volatility regime remaining in place. He had expected that volatility would move higher structurally in the past and this has turned out to be wrong. But He thinks there is a higher probability of being proven correct this time. In other words, rising rates will reduce asset prices, and the question is – have investors and other holders of assets – including property – been lulled into a false sense of security?

All the indicators are that rates will rise – you can watch our blog on this. Rising rates of course are bad news for households with large mortgages, exacerbated by the possibility of weaker ability to service loans thanks to fraud, and poor lending practice. We discussed this, especially in the context of interest only loans, and the problems of loan resets on the ABC’s 7:30 programme on Monday.  We expect mortgage stress to continue to rise.

There was more discussion this week on Housing Affordability. The Conversation ran a piece showed that zoning is not the cause of poor affordability, and neither is supply of property. Indeed planning reform they say is not a housing affordability strategy.  Australia needs a more realistic assessment of the housing problem. We can clearly generate significant dwelling approvals and dwellings in the right economic circumstances. Yet there is little evidence this new supply improves affordability for lower-income households. Three years after the peak of the WA housing boom, these households are no better off in terms of affordability. In part, this may reflect that fact that significant numbers of new homes appear not to house anyone at all. A recent CBA report estimated that 17% of dwellings built in the four years to 2016 remained unoccupied. If we are serious about delivering greater affordability for lower-income Australians, then policy needs to deliver housing supply directly to such households. This will include more affordable supply in the private rental sector, ideally through investment driven by large institutions such as super funds. And for those who cannot afford to rent in this sector, investment in the community housing sector is needed. In capital city markets, new housing built for sale to either home buyers or landlords is simply not going to deliver affordable housing options unless a portion is reserved for those on low or moderate incomes.

But they did not discuss the elephant in the room – booming credit. We discussed the relative strength of different drivers associated with home price rises in a separate, and well visited blog post, Popping The Housing Affordability Myth. But in summary, the truth is banks have pretty unlimited capacity to create more loans from thin air – FIAT – let it be. It is not linked to deposits, as claimed in classic economic theory.  The only limit on the amount of credit is people’s ability to service the loans – eventually. With that in mind, we built a scenario model, based on our core market model, which allows us to test the relationship between home prices, and a series of drivers, including population, migration, planning restrictions, the cash rate, income, tax incentives and credit.

We found the greatest of these is credit policy, which has for years allowed banks to magic money from thin air, to lend to borrowers, to drive up home prices, to inflate the banks’ balance sheet, to lend more to drive prices higher – repeat ad nauseam! Totally unproductive, and in fact it sucks the air out of the real economy and money directly out of punters wages, but make bankers and their shareholders richer. One final point, the GDP calculation we use in Australia is flattered by housing growth (triggered by credit growth). The second driver of GDP growth is population growth.  But in real terms neither of these are really creating true economic growth. To solve the property equation, and the economic future of the country, we have to address credit. But then again, I refer to the fact that most economists still think credit is unimportant in macroeconomic terms! The alternative is to continue to let credit grow well above wages, and lift the already heavy debt burden even higher. Current settings are doing just that, as more households have come to believe the only way is to borrow ever more. But, that is, ultimately unsustainable, and this why there will be an economic correction in Australia, and quite soon. At that point the poor mortgage underwriting chickens will come home to roost. And next time we will discuss in more detail how these scenarios are likely to play out. But already we know enough to show it will not end well.

The Impossible Property Equation – The Property Imperative Weekly – 10 Mar 2018

Today we discuss the Impossible Property Equation.

Welcome to the Property Imperative Weekly to 10th March 2018. Watch the video or read the transcript.

In this week’s review of property and finance news we start with CoreLogic who reported that last week, the combined capital cities returned a 63.6 per cent final auction clearance rate across 3,026 auctions, down from the 66.8 per cent across 3,313 auctions the week prior.  Last year the clearance rate last year was a significantly higher at 74.6 per cent. Last week, Melbourne returned a final auction clearance rate of 66.5 per cent across 1,524 auctions, down from the 70.6 per cent over the week prior.  In Sydney, both volumes and clearance rate also fell last week across the city, when 1,088 properties went to market and a 62.4 per cent success rate was recorded, down from 65.1 per cent across 1,259 auctions the week prior. Across the remaining auction markets clearance rates improved in Canberra and Perth, while Adelaide, Brisbane and Tasmania’s clearance rate fell over the week. Auction activity is expected to be somewhat sedate this week, with a long weekend in Melbourne, Canberra, Adelaide and Tasmania. Just 1,526 homes are scheduled for auction, down 50 per cent on last week’s final results.

In terms of prices, Sydney, Australia’s largest market is a bellwether. There, CoreLogic’s dwelling values index fell another 0.13% this week, so values are down 4.0% over the past 26-weeks.  Also, Sydney’s annual dwelling value is down 1.04%, the first annual negative number since August 2012. Within that, the monthly tiered index showed that the top third of properties by value in Sydney have fallen hardest – down 3.2% over the February quarter – whereas the lowest third of properties have held up relatively well (i.e. down 0.9% over the quarter), thanks to a 68% rise in first time buyers.  My theory is Melbourne is following, but 9-12 months behind.

The RBA published a paper on the Effects of Zoning on Housing Prices. Based on detailed analysis they suggest that development restrictions (interacting with increasing demand) have contributed materially to the significant rise in housing prices in Australia’s largest cities since the late 1990s, pushing prices substantially above the supply costs of their physical inputs. They estimate that zoning restrictions raise detached house prices by 73 per cent of marginal costs in Sydney, 69 per cent in Melbourne, 42 per cent in Brisbane and 54 per cent in Perth. There is also a large gap opening up between apartment sale prices and construction costs over recent years, especially in Sydney. This suggests that zoning constraints are also important in the market for high-density dwellings. They say that policy changes that make zoning restrictions less binding, whether directly (e.g. increasing building height limits) or indirectly, via reducing underlying demand for land in areas where restrictions are binding (e.g. improving transport infrastructure), could reduce this upward pressure on housing prices.

At its February meeting, the RBA Board decided to leave the cash rate unchanged at 1.50 per cent. Their statement was quite positive on employment, but not on wages growth. They are expecting inflation to rise a little ahead, above 2%. They said that the housing markets in Sydney and Melbourne have slowed and that in the eastern capital cities, a considerable additional supply of apartments is scheduled to come on stream over the next couple of years.

The RBA quietly revised down the household debt to income ratio stats contained in E2 statistical releases and their chart pack. It has dropped by 6% from 199.7 down to 188.4, attributing the change to revised data from the ABS. But it is still very high. By the way, Norway, one of the countries mirroring the Australian mortgage debt bubble, at 223 has just taken steps to tighten mortgage lending further. This includes a limit of 5x gross annual income and a 5% interest rate buffer.

We released our February Mortgage Stress data, which showed across Australia, more than 924,500 households are estimated to be now in mortgage stress, up 500 from last month. This equates to 29.8% of households. In addition, more than 21,000 of these are in severe stress, up 1,000 from last month. We estimate that more than 55,000 households risk 30-day default in the next 12 months, up 5,000 from last month. You can watch our separate video on this.  Our surveys showed significant refinancing is in train, to try to reduce monthly repayments. We publish our Financial Confidence Indices next week.

The retail sector is still under pressure, as shown in the ABS trend estimates for Australian retail turnover which rose just 0.3 per cent in January 2018 following a similar rise in December. Many households just do not have money to spend.  Separately, the number of dwellings approved rose 0.1 per cent in January, driven by a lift in approvals for apartments.  Dwelling approvals increased in Victoria, Tasmania, Queensland and Western Australia, but decreased in the Australian Capital Territory, the Northern Territory, South Australia and importantly New South Wales.

The ABS also released the account aggregates to December 2017.  Overall the trend data is still pretty weak. GDP has moved up just a tad, but GDP per capita is growing at just 0.9% per annum, and continues to fall. Much of the upside is to do just with population growth. But net per capita disposable income rose at just 0.4% over the past year. Housing business investment and trade were all brakes on the economy. Real remuneration is still growing at below inflation, so incomes remains stalled. More than two in three households have seen no increase. It rose by 0.3% in the December quarter and was up just 1.3% over the year to December 2017, compared with inflation of 1.9%. In fact, households continue to raid their savings to support a small increase in consumption, but this is not sustainable.  The household savings ratio recovered slightly to 2.7% from 2.5% in seasonally adjusted terms. Debt remains very high. These are not indicators of an economy in prime health!

Another crack appeared in the property market wall this week when Deposit Power, which provided interim finance to property buyers, closed its doors leaving an estimated 10,000 residential, commercial and property investors in the lurch about the fate of nearly $300 million worth of deposits. This is after the collapse of New Zealand’s CBL’s insurance, which was an issuer and guarantor of deposit bonds. You can watch my separate video on this important and concerning event.

The public hearings which the Productivity Commission has been running in relationship to Competition in Financial Services covered a wide range of issues. One which has surfaced is the Lenders Mortgage Insurance (LMI) sector. With 20% of borrowing households required to take LMI, and just two external providers (Genworth and QBE LMI), the Commission has explored the dynamics of the industry. They called it “an unusual market”, where there is little competitive pricing  nor competition in its traditional form.  Is the market for LMI functioning they asked?  Could consumers effectively be paying twice? On one hand, potential borrowers are required to pay a premium for insurance which protects the bank above a certain loan to value hurdle. That cost is often added to the loan taken, and the prospective borrower has no ability to seek alternatives from a pricing point of view. Banks who use external LMI’s appear not to tender competitively. On the other hand, ANZ, for example has an internal LMI equivalent, and said it would be concerned about the concentration risk of placing insurance with just one of the two external players, as the bank has more ability to spread the risks. The Commission probed into whether pricing of loans might be better in this case, but the bank said there were many other factors driving pricing. All highly relevant given the recent APRA suggestion that IRB banks might get benefit from lower capital for LMI’s loans, whereas today there is little capital benefit. This will be an interesting discussion to watch as it develops towards the release of the final report. They had already noted that consumers should expect to receive a refund on their LMI premium if they repay the loan.

ASIC told the Productivity Commission that there is now “an industry of referrers” who are often being paid the same amount as mortgage brokers despite doing less work. They said – in our work on [broker] commissions, there were a separate category of people who are paid commission who don’t arrange the loan but just refer the borrower to the lender. It seems to be that professionals — lawyers, accountants, financial advisers — are reasonably prominent among people who are acting as referrers and that strangely  the commissions they were paid for just a referral was almost as large as that [for a] mortgage broker doing all the extra [work]. More evidence of the complexity of the market, and of the multiple parties clipping the ticket.

The role of mortgage brokers remains in the spotlight, with both the Productivity Commission sessions this week, and the Royal Commission next week focussing in on this area. In draft recommendation 8.1 of its report, the Productivity Commission called for the ASIC to impose a “clear legal duty” on lender-owned aggregators, which should also “apply to mortgage brokers working under them”.  ANZ CEO Shayne Elliott said applying best interest obligations to brokers could help preserve the integrity of the third-party channel and that despite the absence of a legal duty of care, consumers may be under the impression that such obligations already exist. He also said there was merit in considering a fixed fee model as opposed to a volume-based commission paid to brokers. The ANZ chief said that there is “absolute merit” in exploring such a model, and he pointed to the use of a fixed fee structure in Europe.

Industry insiders on the other hand argue that a push to argue a switch from mortgage broker commission payments, which normally includes an upfront fee and a trailing payment for the life of the loan paid by the lender to the broker, to a fixed fee for advice would be “anti-competitive. The discussion of trailing commissions centered on whether there was downstream value being added to mortgage broker clients, for example, annual financial reviews, or being the first port of call when the borrower has a mortgage related question. The interesting question is how many broker transactions truly include these services, or is the loan a set and forget, whilst the commissions keep flowing?  There is very little data on this. In the UK, mortgage brokers work within a range of payment models. Many mortgage brokers are paid a commission by lenders of around 0.38% of the total transaction and some mortgage brokers also charge a fee to their customers.

Still on, Mortgage Brokers they say they expect to write more non-conforming loans over the next 12 months according to non-Bank Pepper Money. They commissioned a survey of 948 mortgage brokers which showed that 70 per cent expect to write more non-conforming loans in the coming year, while 66 per cent predict a decline in the number of prime loans written. Surveyed respondents expect the demand for non-conforming loans to rise as a result of tighter prime lending criteria (22 per cent), changing customer needs (21 per cent) and changing legislation/regulations (13 per cent). The survey also found that the number of brokers who have yet to write a non-conforming loan has also reduced, falling by 6 per cent from 18 per cent in 2016 to 12 per cent in 2018.

Another non-Bank, Bluestone Mortgages cut its interest rates by 75 to 105 basis points across its Crystal Blue products. The Crystal Blue portfolio includes a range of full and alt doc products that provide lending solutions to established self-employed borrowers (with greater than 24 months trading history), and PAYG borrowers with a clear credit history. The lender expects the rate reduction, coupled with the 85% low doc option, to drive the uptake of the portfolio. The rate cuts come shortly after the company was acquired by private equity firm Cerberus Capital Management. Parent company Bluestone Group UK is fully divesting its interest in Bluestone Mortgages Asia Pacific as part of the acquisition deal.

The ABS released their latest data on the Assets and Liabilities of Australian Securitisers. At 31 December 2017, total assets of Australian securitisers were $132.5b, up $7.3b (5.9%) on 30 September 2017. During the December quarter 2017, the rise in total assets was primarily due to an increase in residential mortgage assets (up $6.0b, 6.0%) and by an increase in other loans assets (up $0.9b, 6.1%). You can see the annual growth rates accelerating towards 13%. This is explained by a rise in securitisation from both the non-bank sector, which is going gangbusters at the moment, and also some mainstream lenders returning to the securitised funding channels, as costs have fallen. There is also a shift towards longer term funding, and a growth is securitised assets held by Australian investors.  Asset backed securities issued overseas as a proportion of total liabilities decreased to 2.6%. Finally, at 31 December 2017, asset backed securities issued in Australia as a proportion of total liabilities increased to 89.8%. The non-banks are loosely being supervised by APRA (under their new powers), but are much freer to lend compared with ADI’s.  A significant proportion of business will be investment loans.

It’s not just the non-banks cutting mortgage rates to attract new business.  The story so far. Banks were lending up to 40%+ of mortgages with interest only loans, some even more. The regulator eventually put a 30% cap on these loans and the volume has fallen well below the limit. Some banks almost stopped writing IO loans. They also repriced their IO book by up to 100 basis points, so creating a windfall profit. This is subject to an ACCC investigation to report soon. The RBA and APRA both warn of the higher risks on IO loans, especially on investment properties, in a down turn. APRA has confirmed the “temporary” 30% cap will stay for now, although the 10% growth cap in investment loans is now redundant, thanks to better underwriting standards. Banks have now started to ramp up their selling of new IO loans, to customers who fit within current underwriting standards and are offering significant discounts.  Borrowers will be encouraged to churn to this lower rate.  For example, CBA will cut fixed interest rates for property investors across one-, two-, three-, and four-year terms. The cuts, which range from 5 basis points to 50 basis points, apply to both interest-only investor loans and principal-and-interest investor loans. CBA is also cutting some of its fixed rates for owner-occupiers, including a reduction on owner-occupied principal-and-interest fixed-rate loans by 10 basis points over terms of one to two years, landing at 3.89% for borrowers on package deals. Key rival Westpac also unveiled a suite of fixed-rate changes, including some cuts to fixed-rate interest-only mortgages, another area where banks have been forced to apply the brakes. They also hiked rates across various fixed terms for owner-occupiers. So the chase is on for investor loans now, with a focus on acquiring good credit customers from other banks. Other smaller lenders, such as ING, Mortgage House, and Virgin Money have also dropped some interest-only rates.

Finally, The Grattan Institute released some important research on the migration and housing affordability saying Australia’s migration policy is its de-facto population policy. The population is growing by about 350,000 a year. More than half of this is due to immigration. The pick-up in immigration coincides with Australia’s most recent housing price boom. Sydney and Melbourne are taking more migrants than ever. Australian house prices have increased 50% in the past five years, and by 70% in Sydney. Housing demand from immigration shouldn’t lead to higher prices if enough dwellings are built quickly and at low cost. In post-war Australia, record rates of home building matched rapid population growth. House prices barely moved. But over the last decade, home building did not keep pace with increases in demand, and prices rose. Through the 1990s, Australian cities built about 800 new homes for every extra 1,000 people. They built half as many over the past eight years. So there is no point denying that housing affordability is worse because of a combination of rapid immigration and poor planning policy. Rather than tackling these issues, much of the debate has focused on policies that are unlikely to make a real difference. Unless governments own up to the real problems, and start explaining the policy changes that will make a real difference, Australia’s housing affordability woes are likely to get worse.

So the complex equation of supply and demand, loan availability and home prices, will remain unsolved until the focus moves from tactical near term issues to strategy. Meantime, my expectation is that prices will continue south for some time yet, despite all the industry hype.

Going Down, Down, Down – The Property Imperative Weekly 03 Mar 2018

How far will home prices fall? Welcome to the Property Imperative weekly to 3rd March 2018.

Yet another big big week in property and finance for us to review today. Watch the video or read the transcript.

We start with the latest home price data from CoreLogic.  Prices continue to soften. On an annual basis, prices are down 0.5% in Sydney, 2.7% in Perth and 7.4% in Darwin. They were higher over the year in Melbourne, up 6.9%, Brisbane 1.8%, Adelaide 2.2% and Hobart a massive 13.1%. But be beware, these are average figures, and there are considerable variations across locations within regions and across property types. The bigger falls are being seen at the top end of the market.

Over the three months to February, Adelaide was up 0.1% and Hobart 3.2%. These were the only capital cities in which values rose.  Sydney, which has been the strongest market for value growth over recent years, saw the largest fall in values over the three-month period, down -2.4%. Sydney was followed by Darwin, which has been persistently weak over recent years, and saw values fall by a further -2.0% over the quarter.

Finally, CoreLogic says month-on-month falls were generally mild but broad based. Over the month, values fell across every capital city except Hobart (+0.7%) and Adelaide (steady), with the largest monthly decline recorded across Darwin (-0.9%) and Sydney (-0.6%).  Values were lower in Melbourne (-0.1%), Brisbane (-0.1%), Perth (-0.2%), and Canberra (-0.3%).

The reason for the falls are pretty plain to see. Demand is substantially off, especially from investors, as mortgage underwriting standards are tightening. So it was interesting to hear APRA chairman Wayne Byres’s testimony in front of the Senate Economics Legislation Committee. I discussed this with Ross Greenwood on 2GB. During the session he said that the 10% cap on banks’ lending to housing investors imposed in December 2014 was “probably reaching the end of its useful life” as lending standards have improved. Essentially it had become redundant. But the other policy, a limit of more than 30% of lending interest only will stay in place. This more recent additional intervention, dating from March 2017, will stay for now, despite it being a temporary measure. The 30% cap is based on the flow of new lending in a particular quarter, relative to the total flow of new lending in that quarter. This all points to tighter mortgage lending standards ahead, but still does not address the risks in the back book.  The mortgage underwriting screws are much tighter now – our surveys show that about a quarter or people seeking a mortgage now cannot get one due to the newly imposed limits on income, expenses and serviceability.

During the sessions, Senator Lee Rhiannon asked APRA about mortgage fraud. This was to my mind the most significant part.

Yet even now, more than 10% of new loans are being funded at a loan to income of more than 6 times. And whilst the volume of interest only loans has fallen to 20% of new loans, well below the 30% limit, it seems small ADI’s are lending faster than the majors. And we know the non-banks are going gang busters.

Now the HIA said their Housing Affordability Index saw a small improvement of 0.2 per cent during the December 2017 quarter indicating that affordability challenges have eased thanks to softer home prices in Sydney where they are now slightly lower than they were a year ago. This makes home purchase a little more accessible, particularly for First Home Buyers they said. But they failed to mention the now tighter lending standards which more than negates any small improvement in their index.

The impact of this tightening came through in the latest data on housing finance from both the RBA and APRA. I made a separate video on this if you want the gory details. The RBA said  that in January  owner occupied lending rose 0.6%, or 8% over the past year to $1.14 trillion. Investment lending rose 0.2% or 3% over the past year to $587 billion and comprises 34% of all housing lending.  They changed the way they report the data this month. It changes the trend reporting significantly. Since mid-2015 the bank has been writing back perceived loan reclassifications which pushed the investor loans higher and the owner occupied loans lower. They have now reversed this policy, so the flow of investment loans is lower (and more in line with the data from APRA on bank portfolios). Investor loans are suddenly 2% lower. Magically! Once again, this highlights the rubbery nature of the data on lending in Australia. What with data problems in the banks, and at the RBA, we really do not have a good chart and compass.  It just happens to be the biggest threat to financial stability but never mind.

The latest APRA Monthly Banking Statistics to January 2018 tells an interesting tale. Total loans from ADI’s rose by $6.1 billion in the month, up 0.4%.  Within that loans for owner occupation rose 0.57%, up $5.96 billion to $1.05 trillion, while loans for investment purposes rose 0.04% or $210 million. 34.4% of loans in the portfolio are for investment purposes. So the rotation away from investment loans continues, and overall lending momentum is slowing a little (but still represents an annual growth rate of nearly 5%, still well above inflation or income at 1.9%!). Looking at the lender portfolio, we see some significant divergence in strategy.  Westpac is still driving investment loans the hardest, while CBA and ANZ portfolios have falling in total value, with lower new acquisitions and switching. Bank of Queensland and Macquarie are also lifting investment lending.

Now searching questions are being asked about Lax Mortgage Lending, and the risks the banks are sitting on at the moment. While better lending controls will help ahead, we have a significant problem now, with many households facing financial difficulty. First there is the issue of basic cash flow, as incomes remain contained, costs of living rise, and mortgage payments still need to be met. We estimate 51,500 households risk default in the year ahead, a small but growing problem. We will release the February mortgage stress data on Monday, so look out for that.

Then there is the question of banks and brokers not doing sufficient due diligence on loan applications. This is something the Royal Commission will be looking at in the next couple of weeks.  We worked with the ABC on a story, which aired this week, looking at the issues around poor lending. Its complex of course, because borrowers have to take some responsibility for the applications they made for credit, and need to be truthful. But both brokers and lenders have obligations to make sufficient inquiry into the applicant’s circumstances to ensure the loan is “not unsuitable” – which is nothing to do with the “best” mortgage by the way, it’s a much lower hurdle. But if a loan were deemed to be unsuitable, the courts may change the terms of the loan, or cancel the loan, meaning a borrower could leave a property without debt. An upcoming court case may clarify the law. But in the ABC piece, Brian Johnston, one of the best analysts in the business said this means it moves from being the borrowers problem to being the banks problem!

This also touches on the role of mortgage brokers, and whether their commission based remuneration might influence their loan recommendations, to the detriment of their customers, which is more than half the market. This is something which both ASIC and the Productivity Commission have been highlighting.  Speaking at a CEDA event, Productivity Commission chairman Peter Harris said more than $2.4bn is now paid annually for mortgage broker services. The commission’s draft report released in early February says that based on ASIC’s findings, lenders pay brokers an upfront commission of $2,289 (0.62%) and a trail commission of $665 (0.18%) a year on an average new home loan of $369,000. He zeroed in on trailing commissions – which he said are worth $1bn per annum – and questioned their relevance.

The Banking Royal Commission says the first round of public hearings will be held in Melbourne at the Owen Dixon Commonwealth Law Courts Building at 305 William Street from Tuesday 13 March to Friday 23 March. They listed the range of matters they are exploring, from mortgages, brokers, cards, car finance, add-on insurance and account administration, with reference to specific banks, including NAB, CBA, ANZ, Westpac, Aussie, and Citi. Responsible lending is the theme.

Talking of mortgage brokers, another question to consider is the ownership relationship between a broker, their aggregator and the Bank. Not only are many brokers effectively directly employed by the big banks, but more have strong associations, these relationships are not adequately disclosed.

The New Daily did a good piece on showing these linkages, most of which are hard to spot. They said that Fans of Married at First Sight and My Kitchen Rules may have noticed over the past few days that popular property website realestate.com.au has started advertising a new product: home loans. But Realestate.com.au Home Loans is not an independent initiative. Far from it. It is a deal between Rupert Murdoch’s News Corp, which owns 61.6 per cent of realestate.com.au, and big-four bank NAB. Last June REA Group, the company behind the realestate.com.au website, signed what it called a “strategic mortgage broking partnership” with NAB. What REA Group is actually doing is piggy-backing on a mortgage broker called Choice Home Loans. In other words, while the branding may be realestate.com.au, the actual mortgage broking firm is Choice Home Loans. And who owns Choice Home Loans? NAB does. If you get conditional approval through realestate.com.au, it will be provided by NAB. However, getting conditional approval with NAB does not commit you to a NAB home loan. First, you could choose a realestate.com.au ‘white label’ loan. This is a loan that on the face of it looks like it is provided by realestate.com.au. But once again appearances are deceptive. REA Group does not have a mortgage lenders’ licence. So while these loans may be branded realestate.com.au, they are actually provided by a nationwide mortgage lender called Advantedge. And who owns Advantedge? NAB does. If you don’t fancy the realestate.com.au home loan, there are other choices. First, there is a range of NAB mortgages. And then, there is a list of mortgages from other providers – more than 30 of them, including big names like Westpac, ANZ, Commonwealth Bank, Macquarie, ING, ME, UBank – the list goes on. Oh, and by the way, that last bank mentioned – UBank – is also owned by NAB. All this highlights the hidden connections and the market power of the big banks. Like I said, these relationships are hard to spot!

Another little reported issue this week was the financial viability of Lenders Mortgage Insurers in Australia, those specialist insurers who cover mortgages over 80% loan to value. QBE Insurance reported their full year 2017 results today and reported a statutory 2017 net loss after tax of $1,249 million, which compares with a net profit after tax of $844 million in the prior year. This is a diverse and complex group, which is now seeking a path to rationalisation.  They declared their Asia Pacific result “unacceptable” and said the strategy was to “narrow the focus and simplify back to core” with a focus on the reduction in poor performing segments. This begs the question. What is the status of their Lenders Mortgage Insurance (LMI) business? They reported a higher combined operating ratio consistent with a cyclical slowdown in the Australian mortgage insurance industry, higher claims and a lower cure rate. Very little detail was included in the results, but this aligns with similar experience at Genworth the listed monoline who reported a 26% drop in profit, and provides greater insight into the mortgage sector. Both LMI’s are experiencing similar stresses, with lower premium income, and higher claims. And this before the property market really slows, or interest rates rise!  Begs the question, how secure are the external LMI’s? Another risk to consider.

Last week’s auction preliminary results from Domain said nationally, so far from the 2,627 properties listed for auction, only 1,794 actually went for sale, and 1,325 properties sold. So the real clearance rate against those listed is 50.4%. Domain though calculates the clearance rate on those going to auction, less withdrawn sales over those sold. This give a higher measure of 68.8% nationally, which is still lower than a year ago. But, we ask, which is the real clearance rate?

Finally, there is a rising chorus demanding that APRA loosen their rules for mortgage lending in the face of slipping home prices. This despite the RBA’s recent comments about the risks in the system, especially relating to investor and interest only loans.  But this is unlikely, and in fact more tightening, either by a rate rise, or macroprudential will be needed to contain the risks in the system. The latter is more likely. Some of this will come from the lenders directly. For example, last week ANZ said it will be regarding all interest-only loan renewals as credit critical event requiring full income verification from 5 March. If loans failed this assessment these loans would revert to P&I loans (with of course higher repayment terms).  We are already seeing a number of forced switches, or forced sales thanks to the tighter IO rules more generally. We will release updated numbers next week. But, as ANZ has pointed out in a separate note from David Plank, Head of Australian Economics at ANZ; household leverage is still increasing, this despite a moderation in housing credit growth over the past year. Household debt continues to grow faster than disposable income. With household debt being close to double disposable income it will actually require the growth in household debt to slow well below that of income in order for the ratio of household debt to income to stabilise, let alone fall. In fact, he questions whether financial stability has really been improved so far, when interest rates are so very low.

So, nothing we have seen this week changes our view of more, and significant falls in property values ahead as mortgage lending is tightened further. This also shows that it is really credit supply and demand, not property supply and demand which is the critical controller of home price movements. Another reason to revisit the question of negative property gearing in my view.


The Interest Only Loan Problem – The Property Imperative Weekly 24 Feb 2018

What’s the story with Interest only? Welcome to the Property Imperative Weekly to 24th February 2018.

Welcome to the latest weekly digest of property and finance news. Watch the video or read the transcript.

Michelle Bullock from the RBA spoke about Mortgage Stress and Investor Loans this week. She argued that, based on HILDA data from 2016, mortgage stress was not a major issue, (we beg to differ) but also warned there were elevated risks to Property Investors, and especially those holding interest only loans.  This mirrors APRA’s warnings the previous week. She said that investors have less incentive than owner-occupiers to pay down their debt. Many take out interest-only loans so that their debt does not decline over time. If housing prices were to fall substantially, therefore, such borrowers might find themselves in a position of negative equity more quickly than borrowers with an equivalent starting LVR that had paid down some principal. The macro-financial risks are potentially heightened with investor lending. For example, since it is not their home, investors might be more inclined to sell investment properties in an environment of falling house prices in order to minimise capital losses. This might exacerbate the fall in prices, impacting the housing wealth of all home owners. As investors purchase more new dwellings than owner-occupiers, they might also exacerbate the housing construction cycle, making it prone to periods of oversupply and having a knock on effect to developers.

So we did some further analysis on Interest Only Loans, we already identified that conservatively $60 billion of loans will fail current underwriting standards on reset, which is more than 10% of the portfolio.  We discussed this with Ross Greenwood on 2GB’s Money Show.

But how many loans are interest only, and what is the value of these loans? A good question, and one which is not straightforward to answer, as the monthly stats from the RBA and ABS do not split out IO loans. They should.

The only public source is from APRA’s Quarterly Property Exposures, the next edition to December 2017 comes out in mid March, hardly timely. So we have to revert to the September 2017 data which came out in December. This data is all ADI’s with greater than $1 billion of term loans, and does not include the non-bank sector which is not reported anywhere!

They reported that 26.9% of all loans, by number of loans were IO loans, down from a peak of 29.8% in September 2015. They also reported the value of these loans were 35.4% of all loans outstanding, down from a peak of 39.5% in September 2015.

So, what does this trend look like. Well the first chart shows the value of loans in Sept 2017 was $549 billion, down from a peak of $587 billion in March 2017. The number of loans outstanding was 1.56 million loans, down from a peak of 1.69 million loans in December 2016.

If we plot the trends by number of loans and value of loans, we see that the value exposed is still very high. Finally, the average loan size for IO loans is significantly higher at $347,000 compared with $264,300 for all loans. Despite the fall in volume the average loan size is not falling (so far). The point is the regulatory intervention is having a SMALL effect, and there is a large back book of loans written, so the problem is risky lending has not gone away.

US Mortgage rates continue to climb, following the recent FED minutes which were more upbeat, and continues to signal more rate hikes this year. As a result, average rates moved to their highest levels in more than 4 years.  Moody’s made the point that US Government debt will likely rise by 5.9% in the next year, significantly faster than private sector debt, yet argued that this might not be sufficient to drive rates higher. On the other hand, Westpac argues that the Fed may have to lift rates faster and higher than many expect thanks to strong wage growth and higher government spending, and are forecasting rises of 1.25% ahead. This would have a significant knock-on effect.  In fact, the recent IMF country report on Australia forecast that the average mortgage rate in Australia would rise by 2% to 7.1% in 2021.  That would cause some pain (and lift mortgage stress from ~920k to 1.25m households on our models. We heard this week that the ACCC is due to release its interim report into residential mortgage pricing shortly. As directed by the Treasurer, a key focus will be on transparency, particularly how the major banks balance the interests of consumers and shareholders in making their interest rate decisions.  And the RBA minutes seemed to suggest a wait and see approach to changing the cash rate.

The Royal Commission continues its deep dive into lending misconduct, and announced the dates for the next set of hearings in early March. They also released a background document spotlighting Mortgage Brokers. The data highlights broker share is up to 55% of mortgages, and some of the largest players are owned by the big banks, for example Aussie, is owned by CBA.

Separately ASIC discussed structural conflicts from the relationship between Financial Planners and Mortgage Brokers and the companies who own them and the commission structures which are in place. To reduce the impact of ownership structure, ASIC proposed that participants in the industry “more clearly disclose their ownership structures”.

When asked whether mortgage brokers should come under “conflicted remuneration laws”, ASIC’s Peter Kell said: “There’s been a lot of work done on this, so it’s difficult to get a yes or no answer, but we’ve obviously highlighted in our report that we think there are some aspects of the way that remuneration works in the mortgage-broking sector that would be better to take out of the sector because they raise unreasonable conflicts.”

However, the Productivity Commission has gone a step further by calling for a legal provision to be imposed by ASIC to require lender-owned aggregators to work in the “best interest” of customers.

Draft recommendation 8.1 reads: “The Australian Securities and Investments Commission should impose a clear legal duty on mortgage aggregators owned by lenders to act in the consumer’s best interests.

“Such a duty should be imposed even if these aggregators operate as independent subsidiaries of their parent lender institution, and should also apply to the mortgage brokers operating under them.”

We caught up with several investment management teams this week who are in the country visiting the major banks as part of their regular reviews. One observation which came from these is that the major banks generally believe there will be very little change coming from the plethora of reviews currently in train, so it will be business as usual. We are less sure, as some of the issues being explored appear to be structurally significant.

Economic news this week included the latest wage price data from the ABS. You can clearly see the gap between trend public and private sector rates, with the private sector sitting at 1.9% and public sector 2.4%. The CPI was 1.9% in December, so no real growth for more than half of all households! Victoria was the highest through the year wage growth of 2.4 per cent and The Northern Territory recorded the lowest of 1.1 per cent. So if you want a wage rise, go to the Public Sector in Victoria!

There were more warnings, this time from comparison site Mozo on the risks of borrowers grabbing the “cheap” special mortgage offers which are flooding the market at the moment. Crunching the numbers in the Mozo database, they found that homeowners could pay as much as 174 basis points more when the ‘honeymoon period’ on their home loan ends. In fact, the research revealed that the average homeowner with a $300,000 home loan could end up paying as much as $3,423 in additional interest charges each year if they’re caught taking the introductory rate bait. But this can become an even more costly error when you consider how much extra interest you could end up paying over the life of the loan.

And mortgage underwriting standards continue to tighten as NAB has made a change to its home lending policy amid concerns over the rising household debt to income ratio and as APRA zeroes in on loan serviceability. From Friday, 16 February, the loan to income ratio used in its home lending credit assessment has been changed from 8 to 7.  With the new change, loan applications with an LTI ratio of 7 or less will proceed as normal and will be subject to standard lending criteria, according to the note. But stop and think about this, because a loan to income of 7 is hardly conservative in the current environment. In fact, when I used to underwrite mortgages we used a basic calculation of no more than 3.5 times one income plus one time any second income. We still think underwriting is too loose.

Finally home prices continued to drift lower, especially in Sydney according to CoreLogic, who also said the final auction clearance rate across the combined capital cities rose to 66.1 per cent across a higher volume of auctions last week, with 1,992 auctions held, increasing from the 1,470 auctions the week prior when 63.7 per cent cleared.  But last week’s clearance rate was lower than the 74.9 per cent recorded one year ago when volumes were higher (2,291). So momentum is still sluggish.

We think lending standards, and misconduct will be coming to the fore in the coming couple of weeks leading up to the next Banking Commission Hearing sessions. Remember this, if a loan is judged as “suitable”, it opens the door for recourse to the lender, which may include cancellation or alternation of the loan. Now, if volumes of interest only loans were judged “not suitable” this could open the flood gates on potential claims. Things might just get interesting!